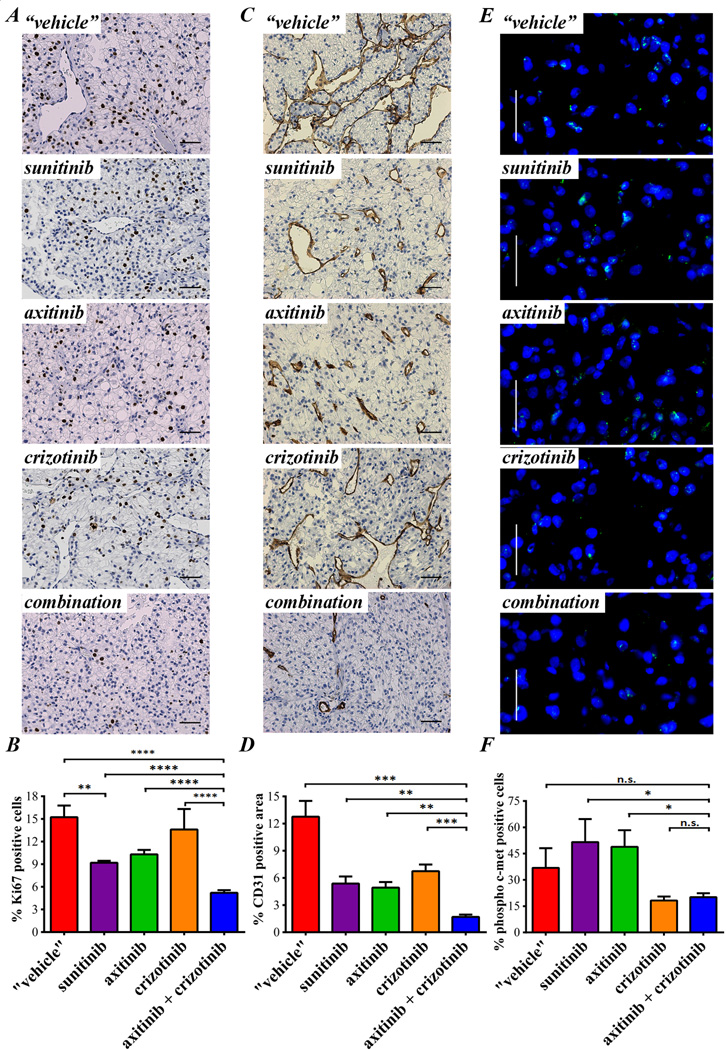
Figure 6. Molecular effects of axitinib and crizotinib in the sunitinib resistant RP-R-01 ccRCC PDX.
Sunitinib resistant RP-R-01 bearing mice treated as in figure 4 were sacrificed after about 5 total months of treatment, tumors harvested, processed, and tissue sections were stained for (A) Ki67 to evaluate proliferation, and (C) CD31 for visualization of endothelial cells. (B) Blinded quantitative analysis of Ki67, expressed as mean percentage positive stained nuclei ± S.E and (D) CD31, expressed as mean percentage positive stained area ± S.E. Scale bar, 50µm. (E) Immunofluorescence staining of phosphorylated c-met (green), DAPI counterstain marks nuclei in blue. Scale bar, 20µm. (F) Blind quantitative analysis of phosphorylated c-met, expressed as mean percentage positive cells ± S.E. * p <0.05, **p <0.01, *** p <0.001, **** p <0.0001 as compared to all other groups, using two tailed t-test analysis.

