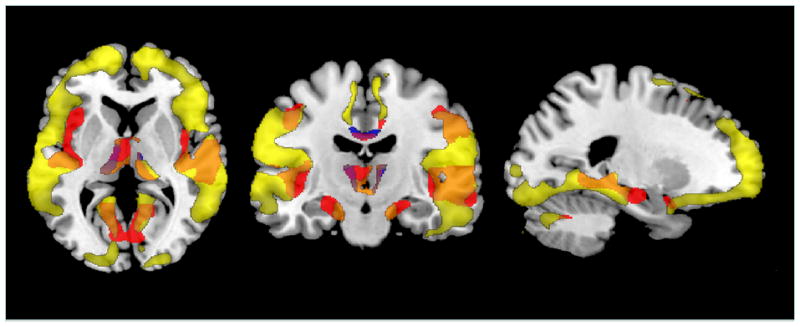
Figure 3.

This figure shows the overlap of main effects of age (red), white matter grade (yellow) and body mass index (blue) on gray matter volume projected onto the Standard Single Subject MNI template (maps created using MRIcron, http://www.cabiatl.com/mricro/mricron/index.html).
