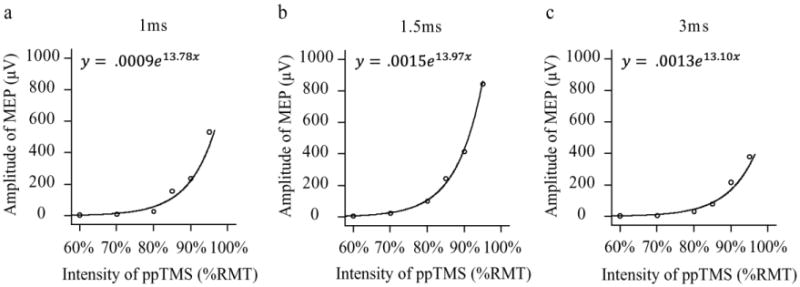
Fig. 3.

Subthreshold summation effects followed a similar exponential function across different ISI. The exponential equation and curve-fit were shown for each ISI that exhibited summation effect (a, b and c). Although the amplitudes were quite different in different ISIs, the fits were excellent and the parameters of the exponential functions were similar
