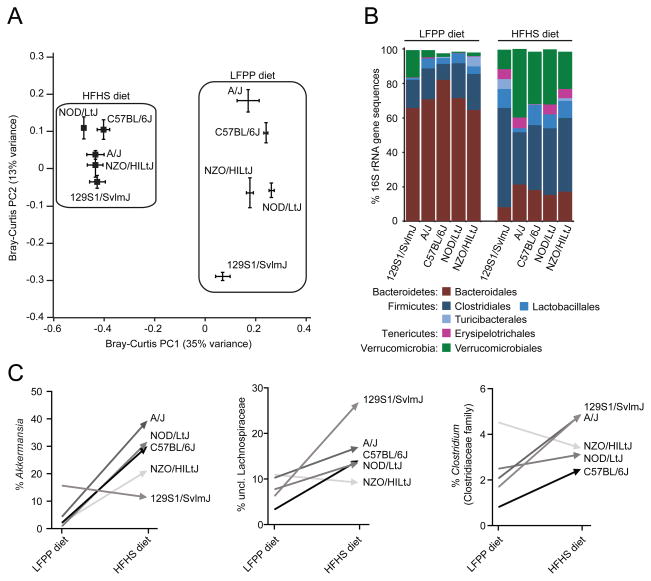
Figure 1. Microbial responses to the high-fat, high-sugar diet in inbred mice.
(A) Microbial community structure is primarily determined by diet (see PC1; F=38.0, p-value<0.001, PERMANOVA on Bray-Curtis distances). Secondary clustering is by host genotype [see PC2; F=9.8, p-value<0.001 (LFPP) and F=2.9, p-value<0.001 (HFHS), PERMANOVA after splitting the datasets by diet]. Bray-Curtis dissimilarity-based principal coordinates analysis (PCoA) was performed on 16S rRNA gene sequencing data; the first two coordinates are shown (representing 48% of the total variance). Values are mean ± sem (n=2–13 animals/group). (B) Relative abundance of major taxonomic orders in 5 strains fed a LFPP or HFHS diet. Groups within the same bacterial phyla are indicated by different shades of the same color. Taxa with a mean relative abundance >1% are shown. (C) Diet-dependent bacterial genera with distinctive changes between genotypes. See Table S2a for the full set of taxa. Different genotypes are indicated by the shade of each line. Values in panels B,C are means (n=2–13 animals/group). See also Figure S1 and Tables S1,S2.

