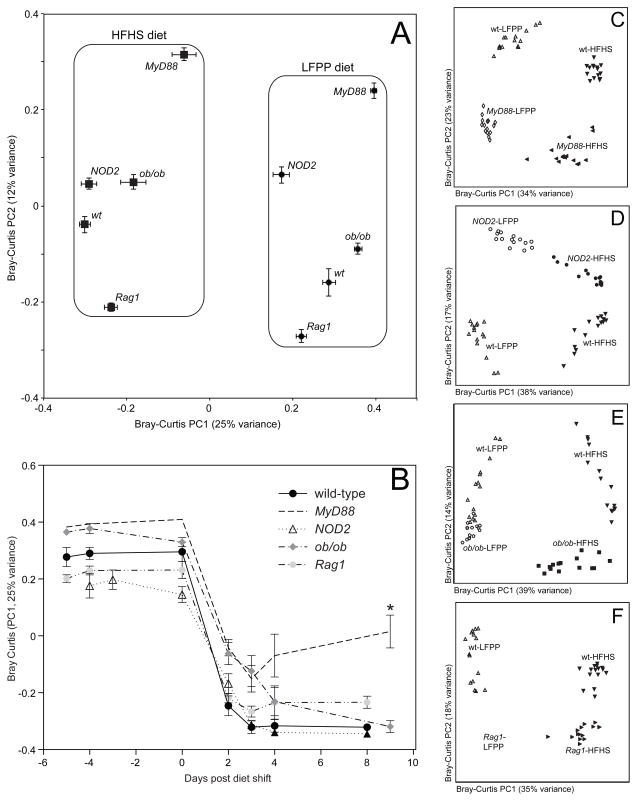
Figure 3. Microbial responses to the high-fat, high-sugar diet in transgenic mice.
(A) Microbial community structure is primarily determined by diet (see PC1; F=60.8, p-value<0.001, PERMANOVA on Bray-Curtis distances). Secondary clustering is by host genotype (see PC2; F=17.9, p-value<0.001). Bray-Curtis dissimilarity-based principal coordinates analysis (PCoA) was performed on 16S rRNA gene sequencing data; the first two coordinates are shown (representing 37% of the total variance). Values are mean ± sem (n=15–20 samples/group). (B) Analysis of the microbial response to the HFHS diet over time, using the first principal coordinate from the Bray-Curtis-based PCoA. Points and lines are labeled based on host genotype. Values are mean ± sem (n=5 mice/group). The asterisk represents significant differences at the final timepoint relative to wild-type controls (p-value<0.05, Kruskal-Wallis test with Dunn’s multiple comparisons test). (C–F) Bray-Curtis-based PCoA of the fecal microbiota of animals on a LFPP (white filled symbols) or HFHS (black filled symbols) diet (n=15 samples/group). Wild-type controls are included in all panels, indicated by white triangles (LFPP diet) and inverted black triangles (HFHS diet). Transgenic mice include: (C) MyD88−/− LFPP (white diamonds) and HFHS (black leftward triangles); (D) NOD2−/− LFPP (white circles) and HFHS (black circles); (E) ob/ob LFPP (white pentagons) and HFHS (black squares); and (F) Rag1−/− LFPP (white squares) and HFHS (black tilted triangles). See also Figure S1 and Tables S1,S2.

