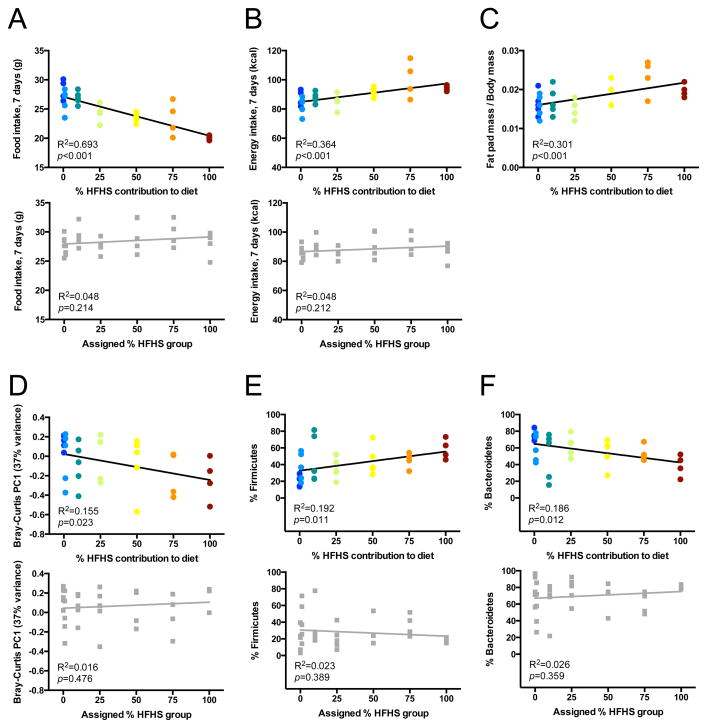
Figure 4. Microbial responses are proportional to the degree of dietary perturbation.
(A–C) Physiological responses of mice to diets with differing HFHS contents: (A) food intake decreases as dietary HFHS content increases; nevertheless both (B) caloric intake and (C) body fat increase on HFHS-rich diets. (D) Dose-dependent relationship between dietary HFHS content and the first principal coordinate from a Bray-Curtis dissimilarity-based PCoA of microbial community composition. (E, F) Dose-dependent relationships between dietary HFHS content and the two most abundant diet-associated bacterial phyla: (E) Firmicutes increase with HFHS content; (F) Bacteroidetes decrease with HFHS content. Within each panel, the upper graph (colored circles) represents data collected during gradient feeding, whereas the lower graph (grey squares) represents data collected during the baseline week, when mice had been assigned to a diet group but had not yet initiated gradient feeding. R2 and p-values reflect linear regression (n=4–5 animals/group). See also Figure S1 and Tables S1,S2.

