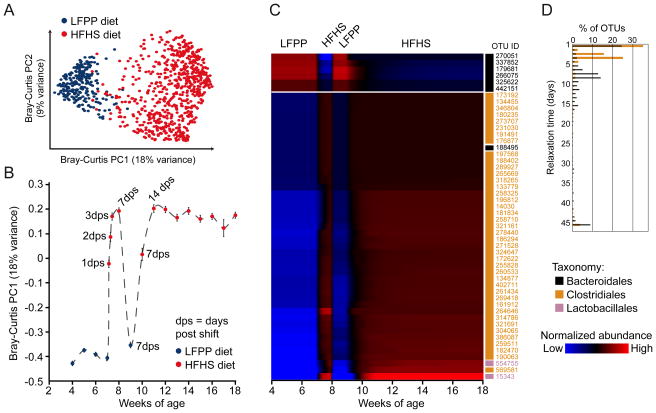
Figure 5. A rapid and reproducible microbial response to the high-fat, high-sugar diet in outbred mice.
(A) Bray-Curtis-based PCoA analysis of the fecal microbiota of animals on a LFPP (blue) or HFHS (red) diet. The first two principal coordinates are shown (representing 27% of the total variance), which clearly separate the 977 fecal samples by diet. (B) Analysis of the microbial response to the HFHS diet over time, using the first principal coordinate from the Bray-Curtis-based PCoA. Points are labeled based on the current diet: LFPP (blue) or HFHS (red). Samples were collected weekly, with daily sampling during the first week of the HFHS diet (indicated by the number of days post shift, dps). On average, 52 mice were sampled at each timepoint. Values are mean ± sem. (C) Time-map of consistently responsive species-level bacterial operational taxonomic units (OTUs) in outbred mice. The selected OTUs were present, responsive, and had consistent temporal patterns in ≥50% of mice. Each row represents a consensus temporal signature (aggregated model estimates across mice) for an OTU, ordered by agglomerative clustering of signatures. Blue indicates relative abundances below the mean abundance for the entire signature, and red indicates relative abundances above the mean. Values represent model estimates, in units of log transformed and standardized relative abundances. The taxonomic assignment for each OTU is indicated on the right of the heatmap: Bacteroidales (black), Clostridiales (orange), and Lactobacillales (pink). (D) Relaxation time constant distributions on the second HFHS diet regimen, for OTUs belonging to the bacterial orders Clostridiales and Bacteroidales (data from all OTUs are shown, including those with inconsistent behavior across mice). Relaxation time characterizes how quickly an OTU’s relative abundance reaches an equilibrium level, with shorter times indicating more rapid equilibration. See also Figures S1–4 and Tables S1,S2,S4.

