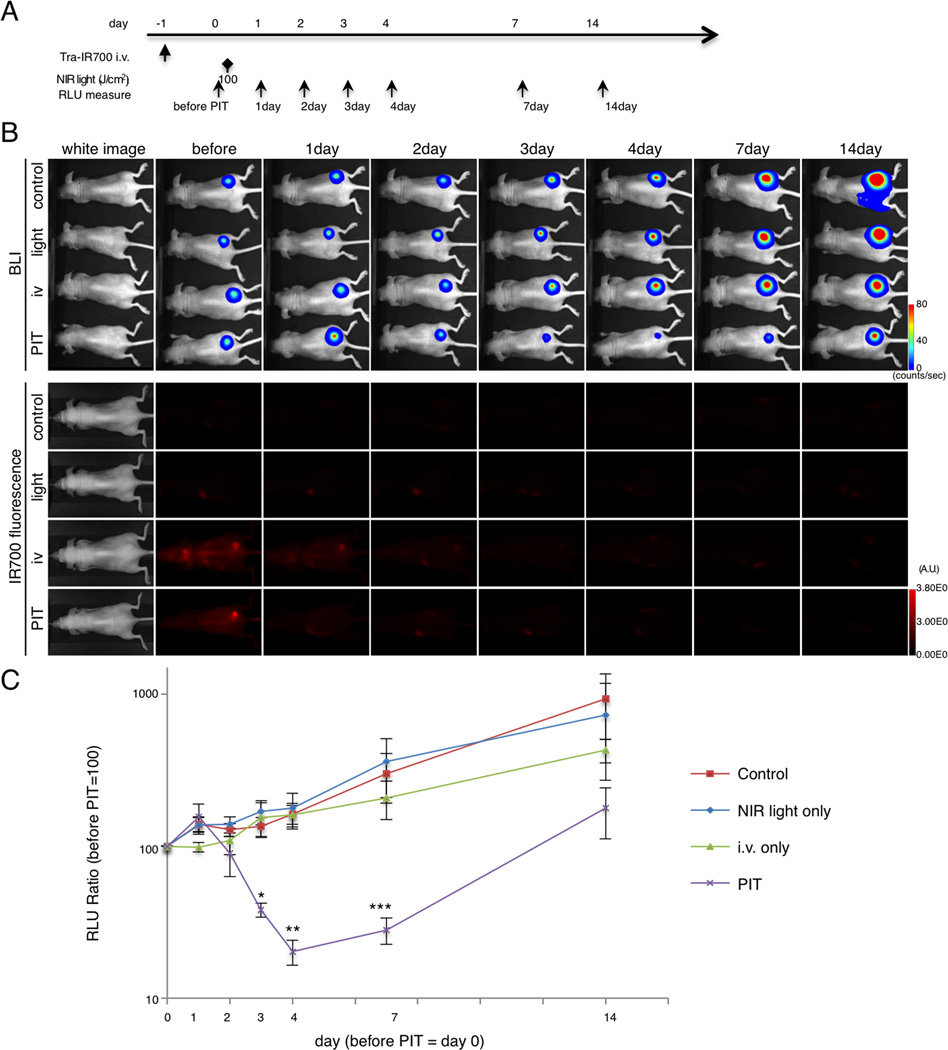
Figure 3. Evaluation of NIR-PIT by luciferase activity in flank model.
(A) The regimen of NIR-PIT is shown. Images were obtained at each time point as indicated. (B) In vivo BLI and fluorescence imaging of tumor bearing mice in response to NIR-PIT. Prior to NIR-PIT, tumors were approximately the same size and exhibited similar bioluminescence. (C) Quantitative RLU showed a significant decrease in PIT-treated tumors (n = 5 mice in each group (PIT group vs light only group at day 3, *p = 0.0137 < 0.05)(PIT group vs control group at day 4, **p = 0.0237 < 0.05)(PIT group vs light only group at day 4, **p = 0.0385 < 0.05)(PIT group vs control group at day 7, ***p = 0.0301 < 0.05)(PIT group vs light only group at day 7, ***p = 0.0255 < 0.05), Kruskal-Wallis test with post-test).

