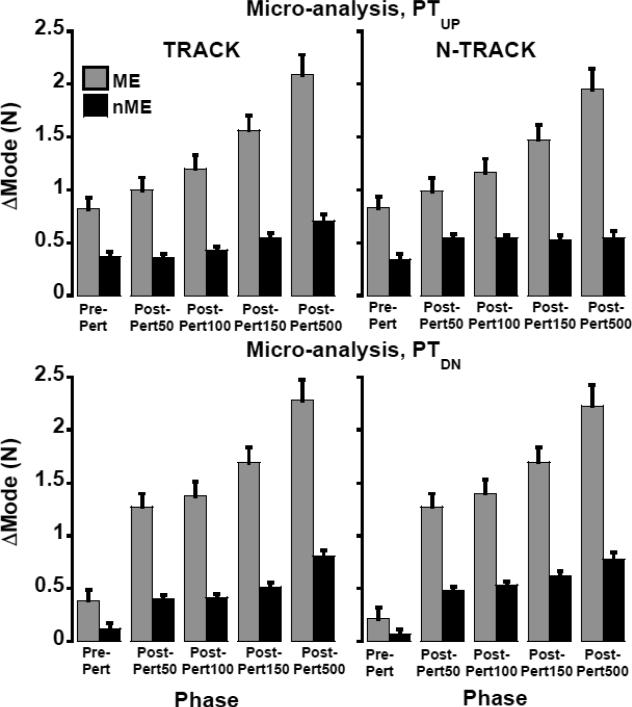
Figure 5.
Motor equivalence analysis during phases pre-, and post-perturbation (Post-Pert50, Post-Pert100, Post-Pert150, Post-Pert500) following PTUP (upper plots) and PTDN (lower plots) for TRACK (left plots) and N-TRACK (right plots) tasks in the mode space. Analysis in the force space (not shown) had similar profiles. Means ± standard errors are shown.

