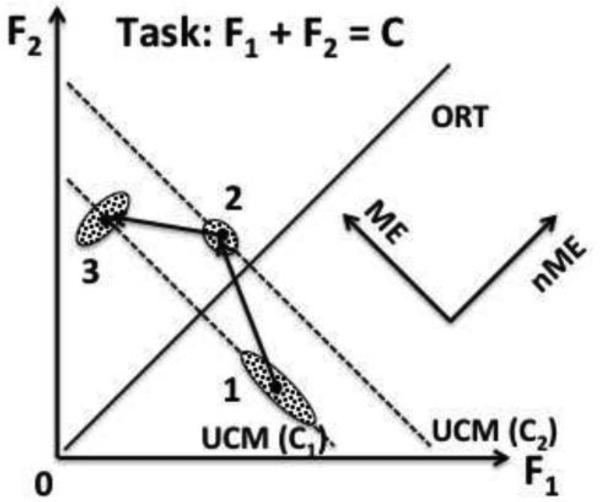
Figure 6.
An illustration of the idea of motor equivalence. Two effectors are involved in a common task F1 + F2 = C. In the initial steady state (C = C1, cloud of data points 1), inter-trial variance is mostly along the UCM for this task (dashed line). A perturbation changes the output of the system to C2 (cloud of points 2). It is expected to lead to larger deviation along the less stable direction (ME, along the UCM) as compared to more stable direction (nME, along ORT). A correction leads to the same output of the system, C1 (cloud of points 3), again with a large ME deviation along the UCM. Note that the ME vs. nME deviations may be associated with different structure of inter-trial variance as illustrated with the different shapes of the clouds of data points.

