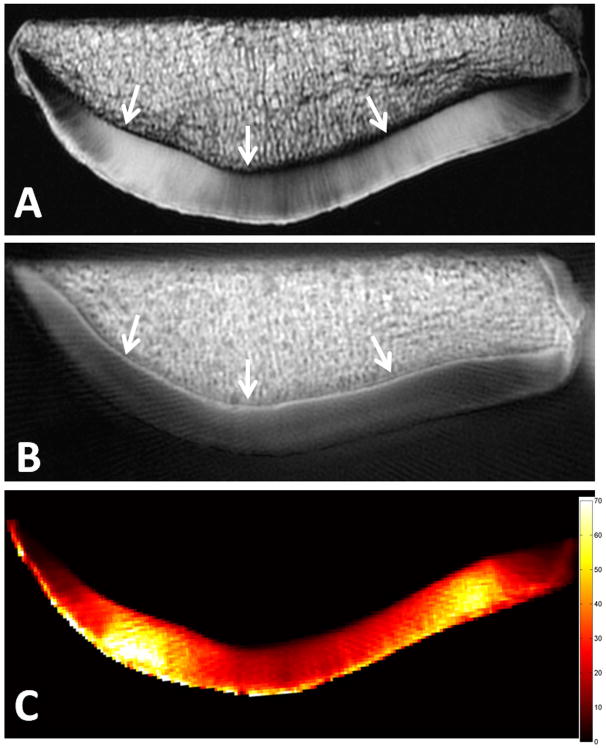
Figure 4.

Axial MR images of a patella. High resolution spin-echo sequence with 38 ms TE (A) shows no signal from the deep radial and calcified cartilage (arrows). 8 μs minus 5 ms subtraction image (B) highlights the calcified layer of cartilage (arrows). Pixel map of mono-exponential T2* values generated from UTE images (C) with bi-exponential analysis yielding short T2* of 0.7 ms, short fraction 23%, long T2* 37.7 ms, and long fraction 77% (plot not shown).
