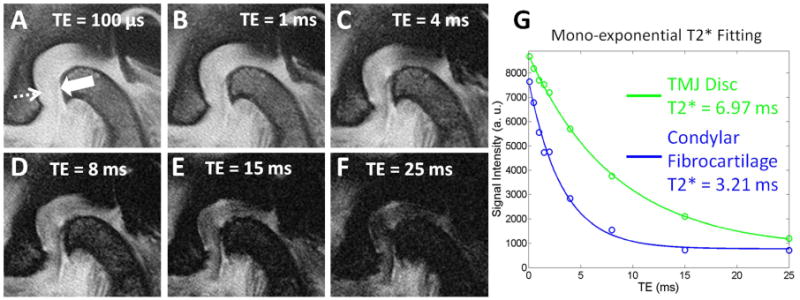
Figure 8.

Sagittal MR images through the TMJ. Select multi-echo images ranging from 100 μs to 25 ms (A-F) show condylar fibrocartilage (solid arrow) and TMJ disc (dashed arrow). Mono-exponential T2* fitting curve (G) shows excellent curve fitting with T2* values of 6.97 ms and 3.21 ms for the disc and fibrocartilage, respectively.
