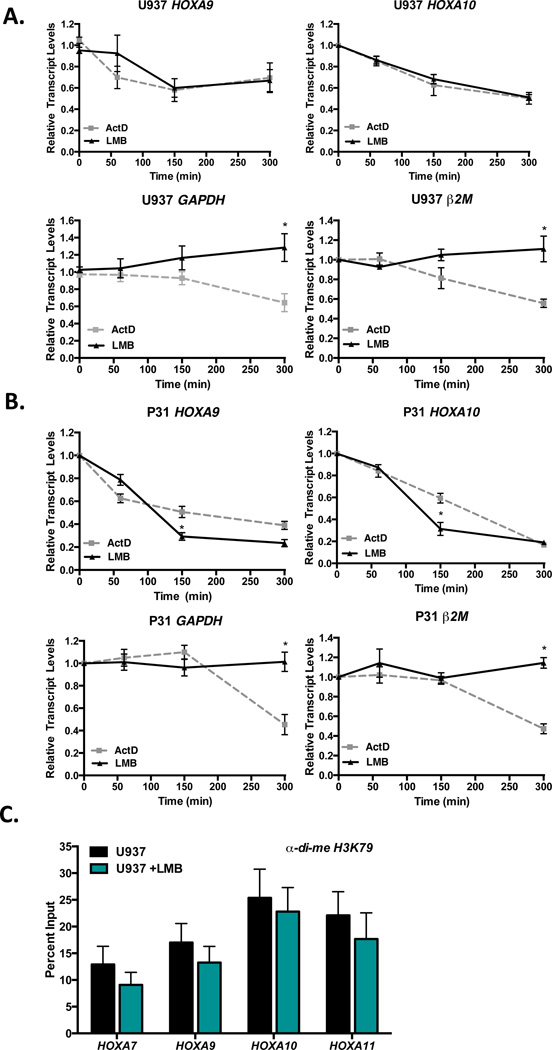
Figure 4. Leptomycin B and Actinomycin D inhibit HOXA expression with similar kinetics in human CALM-AF10 leukemia cell lines.
Human CALM-AF10-positive leukemia cell lines U937 (A) and P31/Fujioka (P31; B) were treated with 5 µg/ml ActD or 0.7 nM LMB for 60, 150, or 300 min, and real time qRT-PCR was performed. HOXA9, HOXA10, GAPDH or β2M transcript levels were normalized to time zero (untreated). Results are shown as mean ± SEM from at least 3 experiments. Statistical analysis was performed by two-way ANOVA followed by Bonferroni’s Multiple Comparison Test; *P<0.05 (C) ChIP analysis of di-methylated H3K79 in the promoter regions of HOXA cluster genes in human CALM-AF10 U937 cells. Results were generated by qRT-PCR and are shown as a percent of input. Results are shown as mean ± SEM from 3 experiments.

