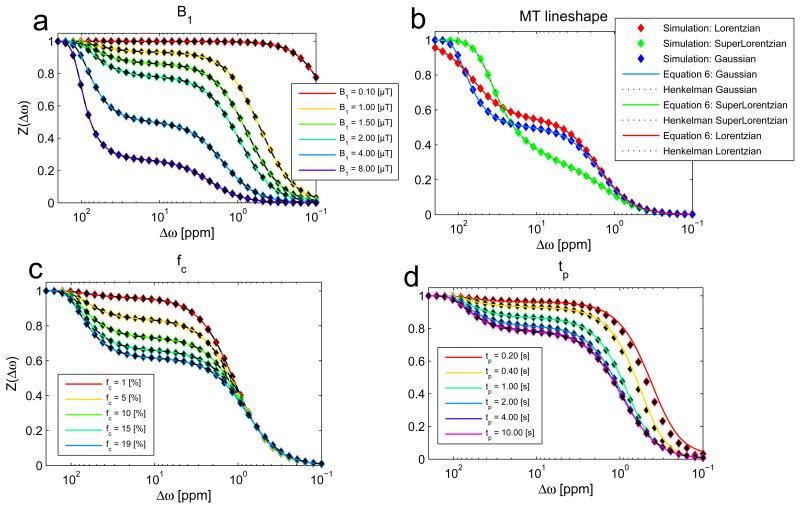
Figure 3.
The R1ρ-model (solid lines) matches the full numerical simulation (dots) as well as the Henkelman solution (dashed lines) for different B1 (a), different MT lineshapes (b) and different MT pool sizes up to 19% (c). In contrast to the Henkelman model, the R1ρ-model is also able to describe non-steady-state irradiation (d): As other eigenvalues than R1ρ become more important for short irradiation times, the R1ρ-model deviates from the full simulation for saturation times much lower than T1. For offsets relevant for CEST (>1ppm) the R1ρ-model is accurate already after ~0.4 s of irradiation.

