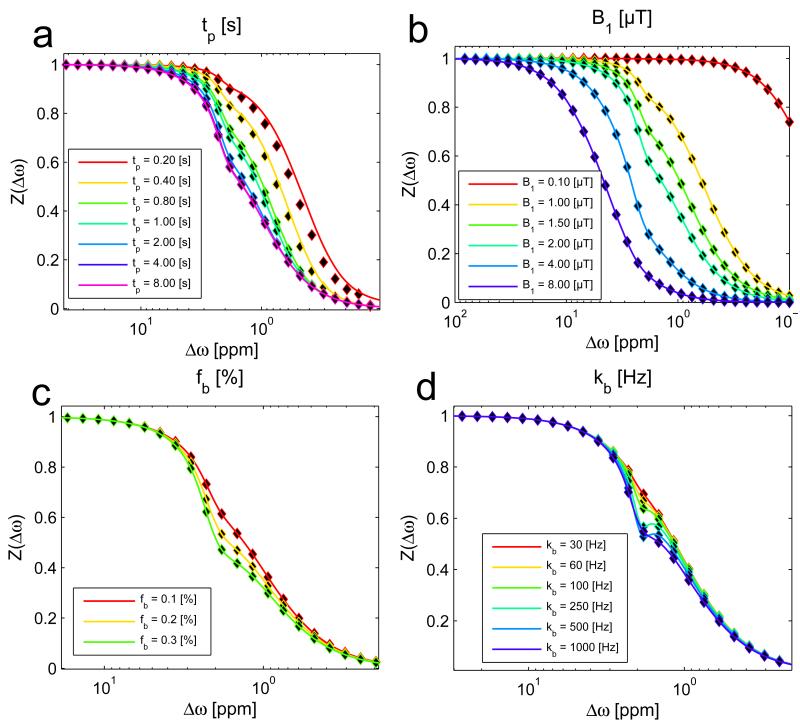
Figure 5.
Interaction of CEST and MT: The R1ρ-model (solid lines) matches the full numerical simulation (dots) for different saturation times (a) after ~0.4 s of irradiation, for different irradiation power B1 (b) and different CEST pool sizes (c), as well as for very different exchange rates of the CEST pool (d). For detailed view of CEST effects see the asymmetry plots in figure 6.

