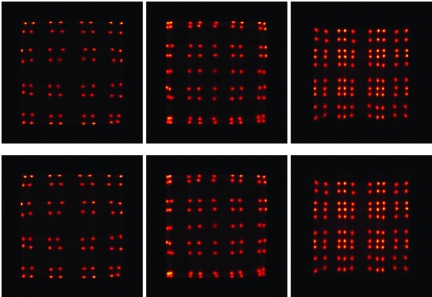
FIG. 11.

Flood histograms of (left column) pitch 1.5 mm, (middle column) pitch 1.35 mm, and (right column) pitch 1.0 mm LYSO or LSO crystal arrays. Flood histograms shown in top row and bottom row were obtained by coupling crystal arrays sequentially and simultaneously.
