
Figure 2. Group × Time Interaction for Amygdala (A) and Nucleus Accumbens (B) activation.
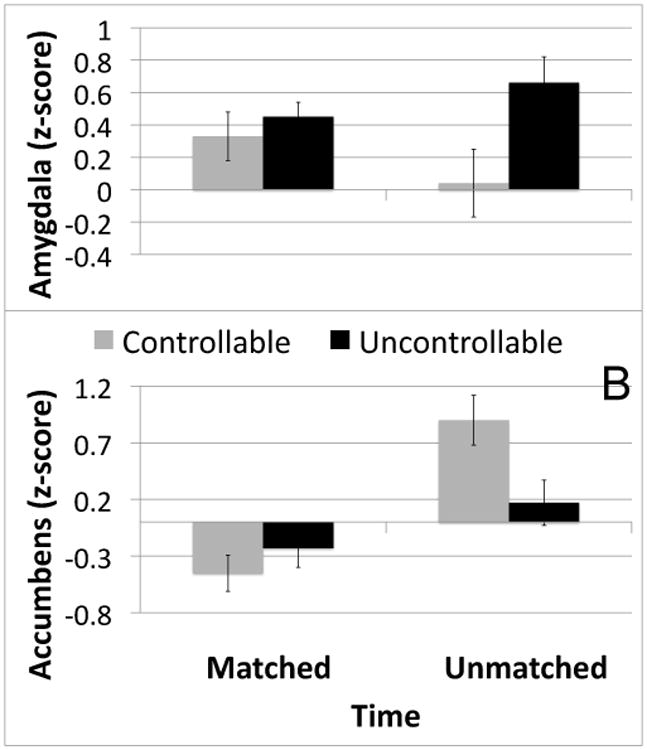
The group × time interaction was significant for anatomically defined clusters in both amygdala (F1, 50=4.02, p=0.05) and nucleus accumbens (F1, 50=5.95, p<0.05). Groups did not differ on matched trials for either region.