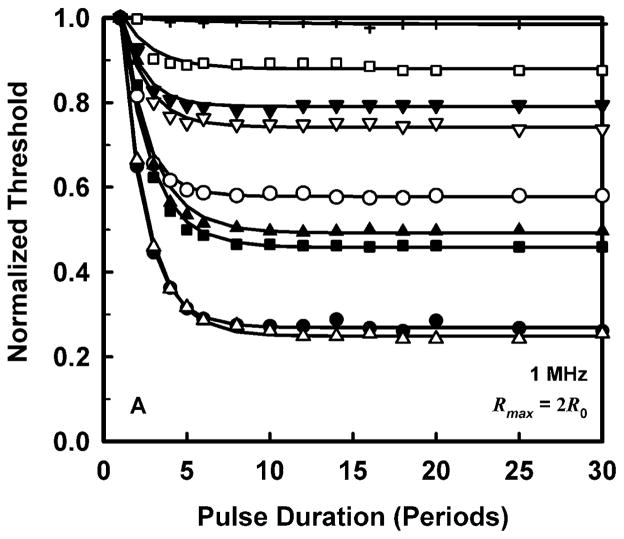
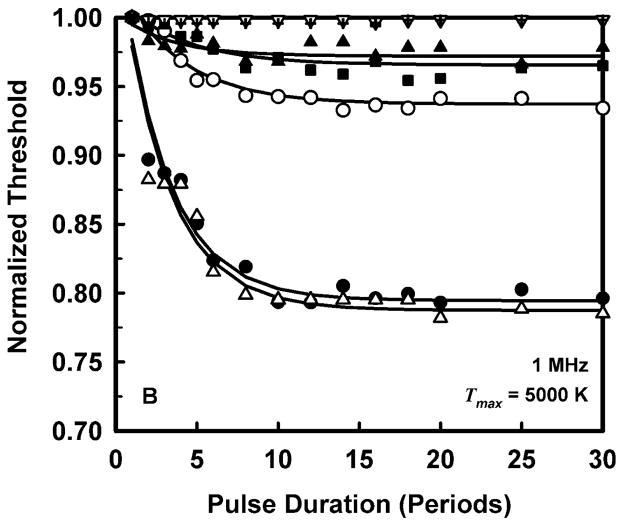
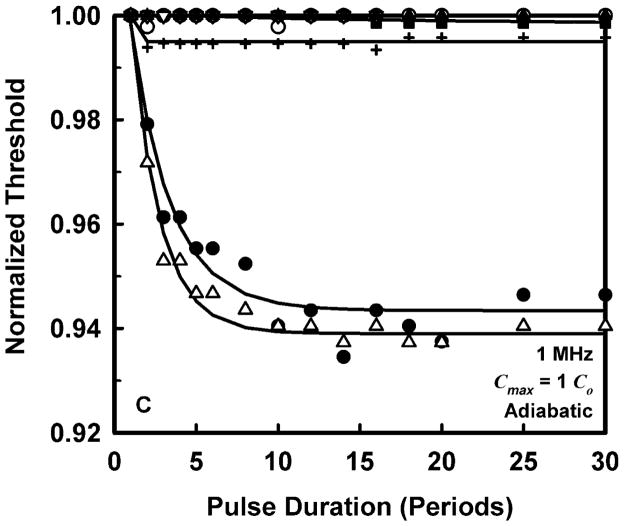
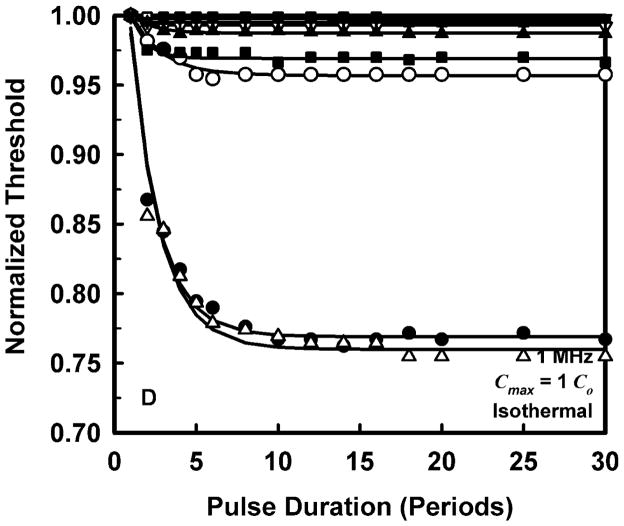
Figure 3.
Normalized thresholds for inertial cavitation at 1 MHz in water (●), urine (△), blood (○), brain (▼), heart (□), kidney (■), liver (▽), skeletal muscle (▲), and skin (+), as a function of pulse duration for threshold criteria of Rmax = 2R0 (A), Tmax = 5000 K (B), Cmax,a = 1C0 (C) and Cmax,i = 1C0 (D). Curves are the best fits of Pt = A + Bexp(PD) to the data (points).


