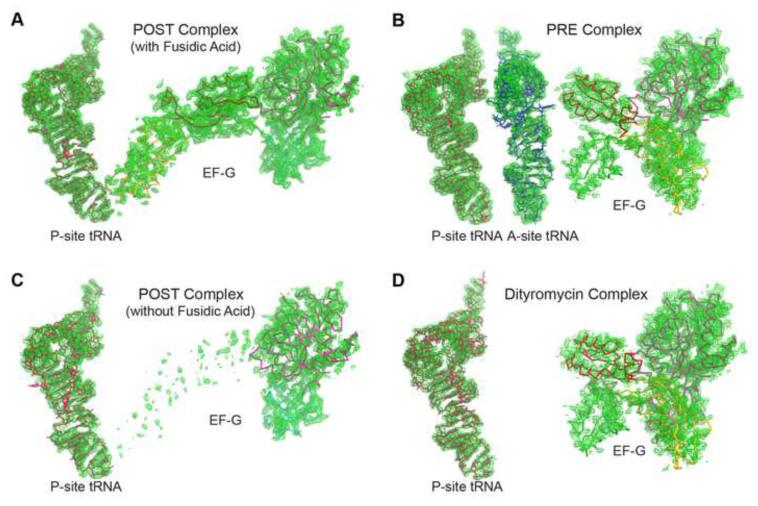
Figure 2. Partial electron density for the POST and PRE complexes.
(A-D) Unbiased Fobs – Fcalc difference Fourier map of EF-G and the P-site tRNA in the POST complex in the presence of fusidic acid (A), EF-G and the A- and P-site tRNAs in the PRE complex (B), EF-G and the P-site tRNA in the POST complex in the absence of fusidic acid (C), and EF-G and the P-site tRNA in the dityromycin complex (D). All maps are contoured at 2.5σ obtained after initial refinement with an empty ribosome as a starting model.
See also Table S1.

