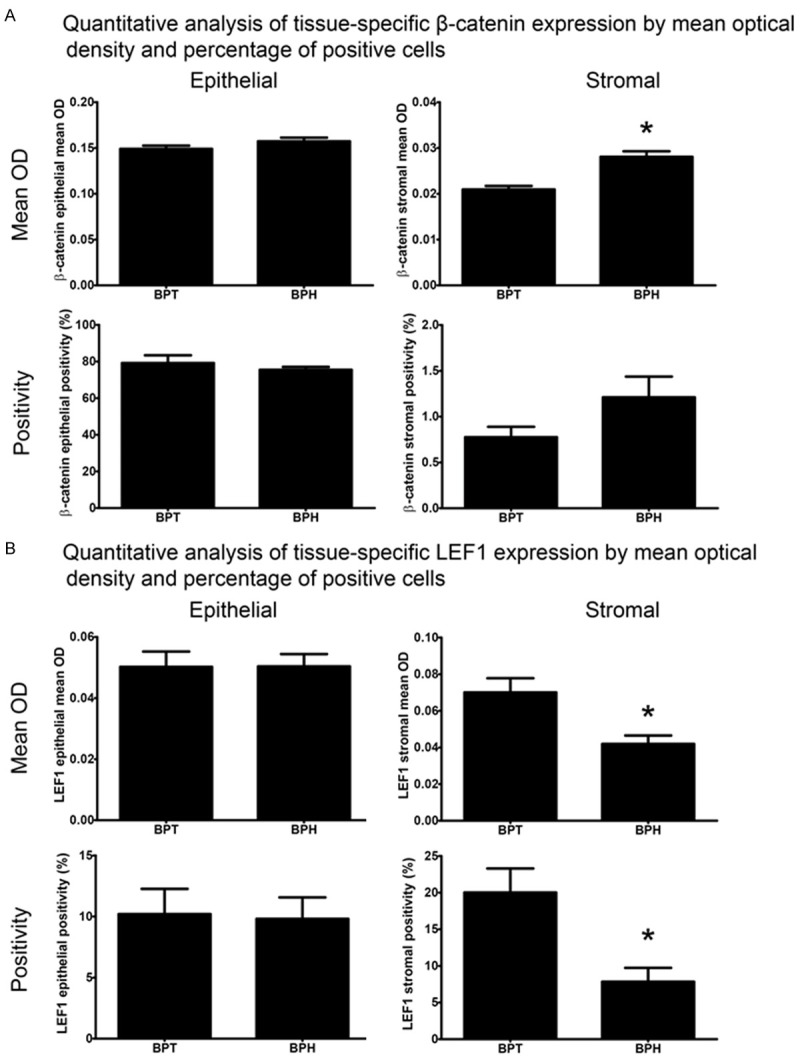
Figure 2.

Quantitative analysis of tissue-specific CTNNB1 or LEF1 staining abundance by mean optical density (OD) and percentage of immunopositive cells within tissue. No differences in epithelial CTNNB1 staining were observed as assessed by mean OD (p = 0.15) or positivity (p = 0.54) analysis (A). Stromal CTNNB1 staining was significantly higher in BPH (mean = 0.028, SEM = 0.001) than BPT (0.021 ± 0.001; p<0.0001) in mean OD analysis. Stromal CTNNB1 positivity was higher in BPH than BPT but failed to reach significance (p = 0.06). Epithelial LEF1 staining was similar between BPT and BPH in both mean OD (p = 0.99) and positivity (p = 0.90) analysis (B). Analysis of stromal LEF1 staining by mean OD displayed significantly lower expression in BPH (0.042 ± 0.005) compared to BPT (0.070 ± 0.008; p = 0.02). LEF1 positivity in the stroma also showed a significantly lower amount of positive cells in BPH (mean = 7.84%, SEM = 1.89) compared to BPT (20.01 ± 3.28; p = 0.02).
