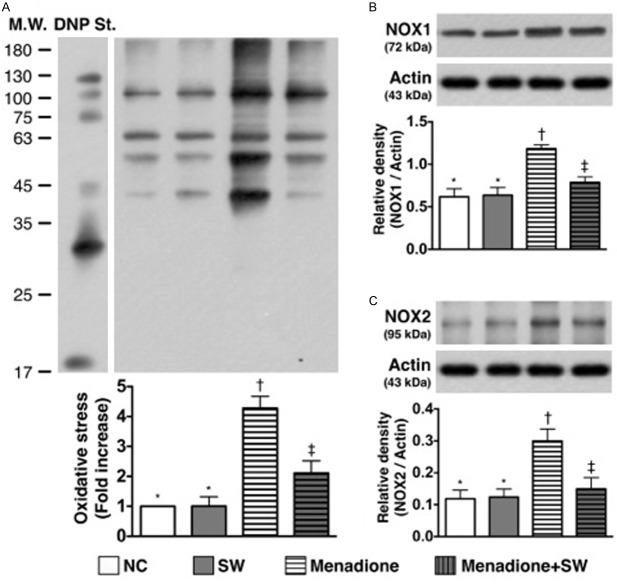
Figure 2.
Protein expressions of reactive oxygen species and oxidative stress of smooth muscle cells under menadione stimulation and ECSW therapy (n = 6). A. Protein expression of oxidative index (protein carbonyls). *vs. other group with different symbols, p < 0.0001. (Note: left and right lanes shown on the upper panel represent protein molecular weight marker and control oxidized molecular protein standard, respectively). DNP = 1-3 dinitrophenylhydrazone. B. The protein expression of NOX-1. *vs. other group with different symbols, p < 0.001. C. The protein expression of NOX-2. *vs. other group with different symbols, p < 0.001. All statistical analyses using one-way ANOVA, followed by Bonferroni multiple comparison post hoc test. Symbols (*, †, ‡) indicate significance (at 0.05 level). SW = shock wave; LPS = lipopolysaccharide.

