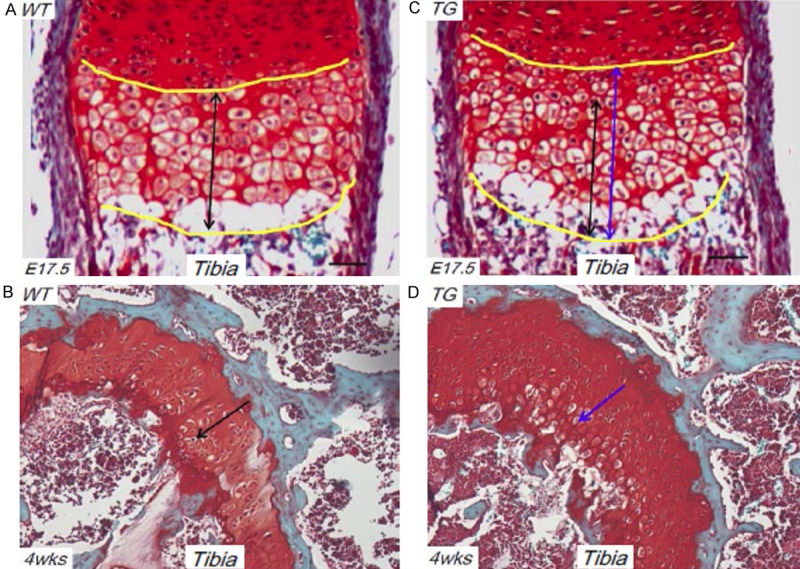
Figure 1.

Delayed chondrocyte maturation in Col10a1-Runx2 mice. (A) Safranin O staining of sagittal section of tibia from E17.5 WT mouse embryo show organized hypertrophic chondrocytes as indicated by double black arrow. (B) Hypertrophic chondrocytes can be appreciated in tibia section of 4 wks WT mouse as shown by Safranin O staining (black arrow). (C) Compared to tibia section of E17.5 WT mouse (A), TG mouse displays much longer hypertrophic zone (more layers and disorganized hypertrophic chondrocytes) as indicated by double blue arrow. (D) Compared to tibia section of 4 wks WT mouse (B), 4 wks TG mouse also displays more layers and disorganized hypertrophic chondrocytes as indicated by blue arrow. WT: wild-type; TG: transgenic.
