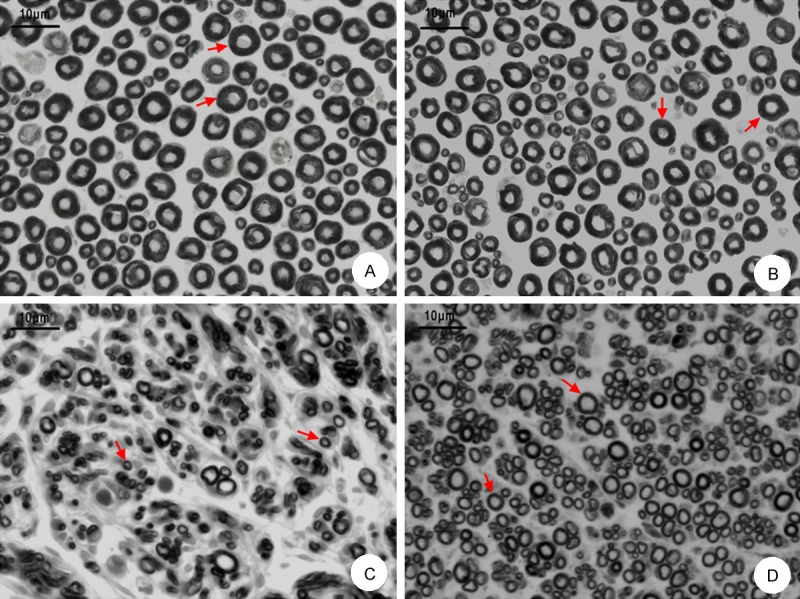
Figure 5.

Histological study results in each group. A: Morphological changes in the proximal nerve segment by osmium tetroxide staining (×400); B: Morphological changes in the distal segment in the normal group (×400); C: Morphological changes in the distal segment in the model group (×400); D: Morphological changes in the distal segment in the treatment group (×400). Arrows indicate the myelin sheathes, scale bar indicates 10 μm.
