Figure 2.

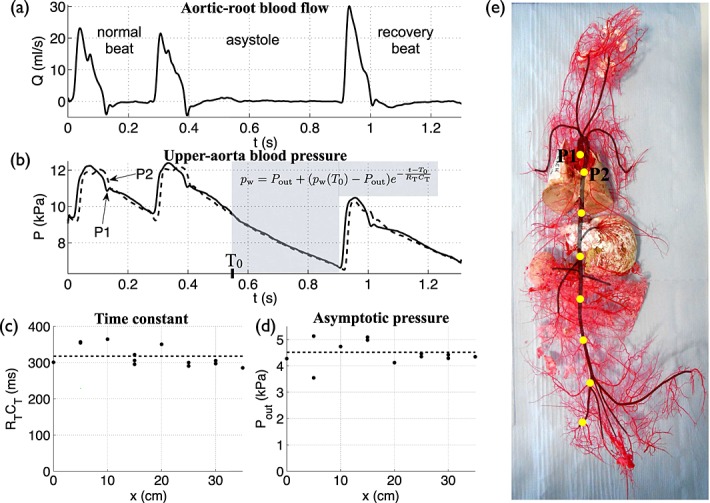
In vivo (a) flow rate at the aortic root and (b) pressure at the aortic root (P1) and 5 cm distally in the aorta (P2) with time, measured during an asystole in Rabbit 8. (c) Time constant ( ) and (d) asymptotic pressure (Pout) calculated along the aorta and iliac artery at 5 cm increments (indicated by yellow dots in (e)).
  and Pout were derived from an exponential function (Equation (19)) fitted to the decline in pressure during an asystole (shaded area in (b)). Dashed lines indicate the corresponding average values. (e) Cast of the systemic vasculature of Rabbit 8. The aorta and its main branches are shaded.
