
Figure 3.
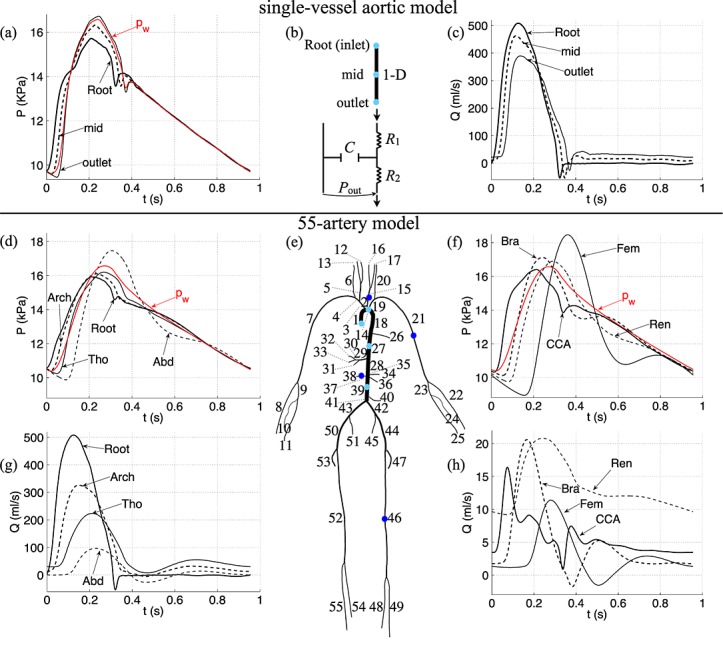
Pressure and flow rate with time, at (a,c) the inlet, midpoint and outlet of a single-vessel model of the human thoracic aorta (b) 35 and (d-h) the aortic root (Root, Segment 1), midpoint of the aortic arch B (Arch, Segment 14), thoracic aorta B (Tho, Segment 27) and abdominal aorta D (Abd, Segment 39), left common carotid (CCA, Segment 15), left brachial (Bra, Segment 21), right renal (Ren, Segment 38) and left femoral (Fem, Segment 46) arteries of a model of the 55 larger systemic arteries in the human (e) 1. They were calculated using the nonlinear purely elastic (a,c) and visco-elastic (d,f,g,h) 1-D equations (1) and (2). At the root of both models, we prescribed a flow rate measured in vivo (labelled ‘Root’ in (c,g)). At the outlet of each terminal branch, we coupled a three-element Windkessel model of the perfusion of the microcirculation (b), with R1 = Z0 to minimise wave reflections 42. The properties of the aortic model are shown in Table II. The names and properties of the segments in the 55-artery model are shown in Table III. The uniform Windkessel pressure, pw, given by Equation (17) is shown in red in (a,d,f).