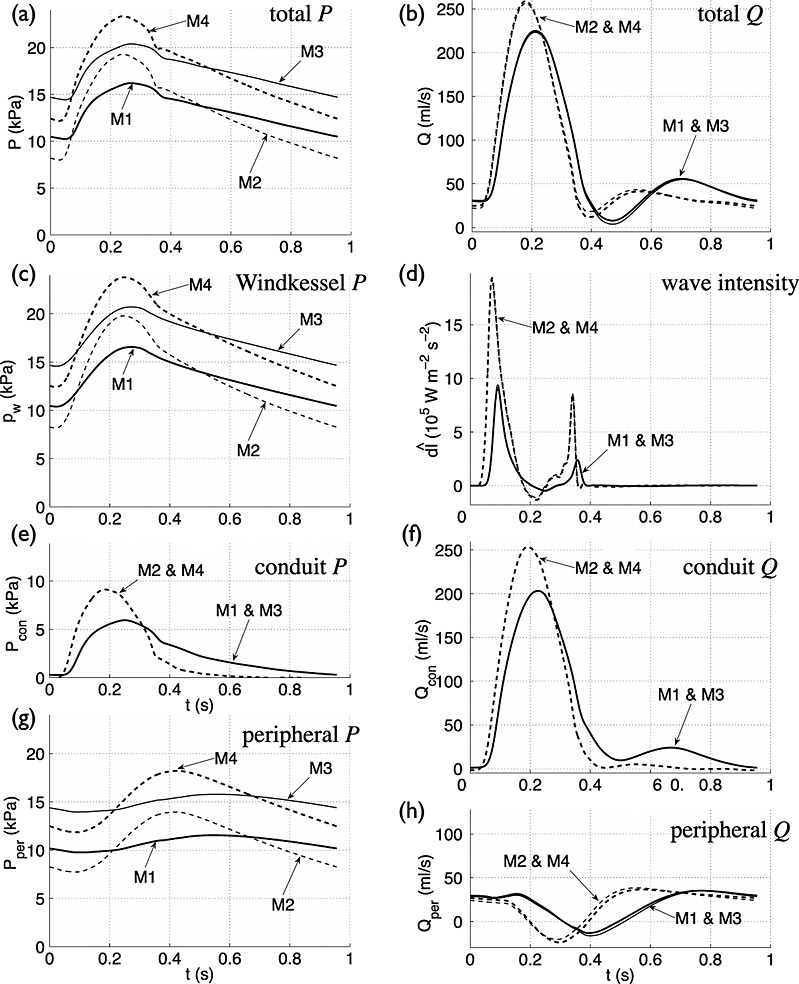
Figure 11.

(left) Total (a), Windkessel (c), conduit (e) and peripheral (g) pressures with time in the thoracic aorta (midpoint of Segment 27 in Figure 3(e)) of the normal young (M1), normal old (M2), hypertensive young (M3) and hypertensive old (M4) models described in Section 3.10. (right) Total (b), conduit (f) and peripheral (h) flow rates and modified wave intensity (d) with time at the same location and models.
