
Figure 12.
(a,d) Forward  and backward
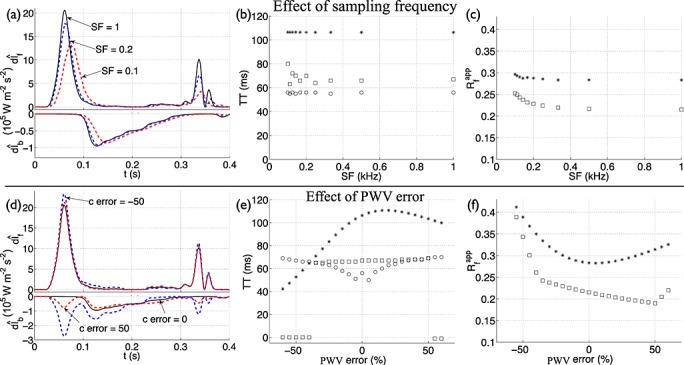
  components of modified wave intensity with time in the midpoint of the single-vessel aortic model coupled to a matched RCR Windkessel outflow model (Figure 3(b)). They were calculated using the original model (black solid lines), with c at diastolic pressure, and changing the (a) sampling frequency (SF in kHz) or (d) error in the PWV relative to the theoretical PWV (c error in %), as indicated by the labels (red and blue dashed lines). In the original model, we have SF = 1 kHz and c error = 0%. Note the different scaling of
  and
and  . Effect of (b,c) SF and (e,f) PWV error on the transit time (TT) and apparent reflection coefficient
  calculated using foot (circles), peak (squares) or area-average (stars) values, as illustrated in Figure 5.