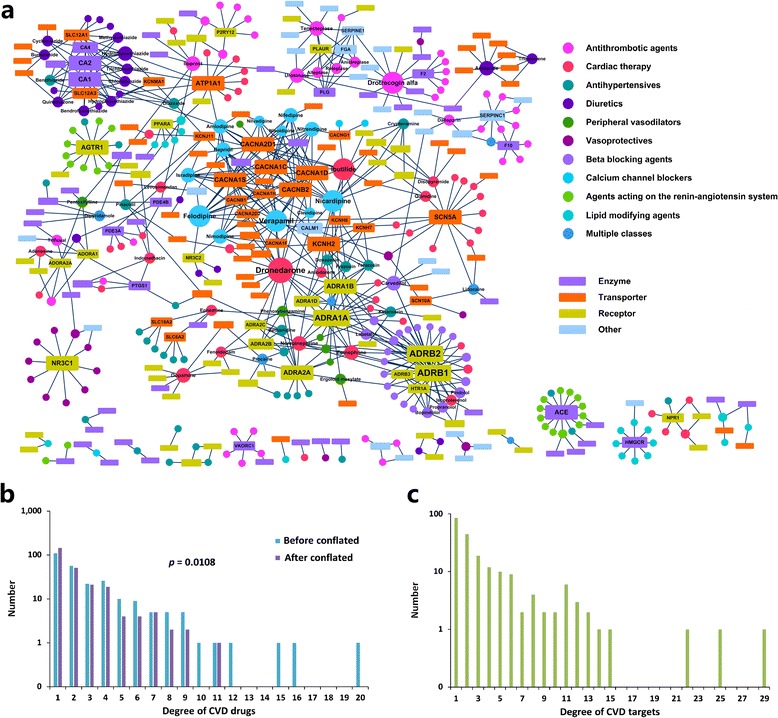
Figure 2.

The drug–target network. (a) The drug-target network was generated from the known associations between FDA-approved cardiovascular drugs and their target proteins. Nodes represent drugs (shown as circles) and targets (shown as rectangles). A link is placed between a drug and a target node if the protein is a known target of the drug. The size of the drug (protein) node is proportional to the number of the relevant targets (the number of the relevant drugs). Drugs are colored according to their Anatomical Therapeutic Chemical (ATC) Classification, and targets are colored according to protein family obtained from the Uniprot database. (b) Distribution of target proteins for drugs (drug node degrees) in the drug-target network. This distribution shows most cardiovascular drugs target a small number of targets, but some of them have many targets. (c) Distribution of drugs for their targets (target node degrees) in the drug-target network. Most targets have a few drugs, but some targets have many drugs.
