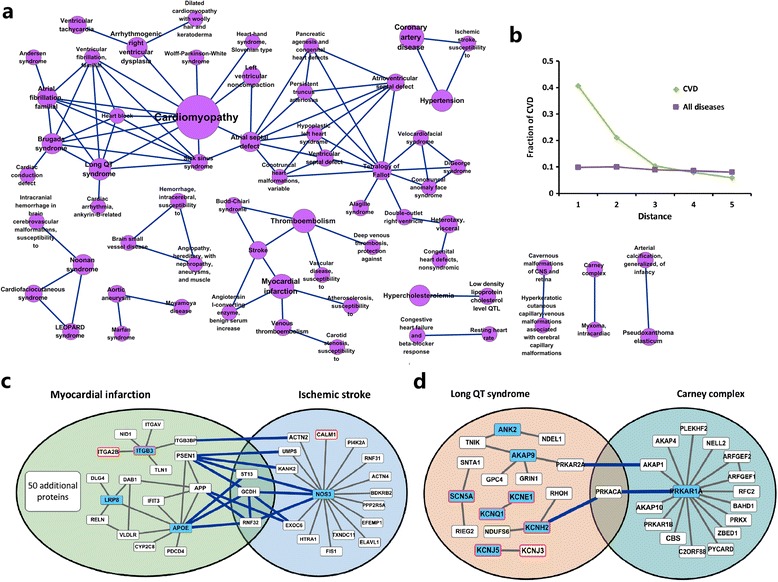
Figure 4.

Relationships between different cardiovascular disorders. (a) Selected networks from the gene disease-disease network (GDD network). This network is composed by cardiovascular disorders separated from the GDD network, where each node corresponds to a disorder and two disorders are linked if there is a gene involved in both. The size of each node corresponds to the number of genes that are implicated in this disease. This network shows many cardiovascular disorders tend to related to other cardiovascular disorders. (b) Fraction of cardiovascular disorders starting from either a cardiovascular disorder or a random disorder in the GDD network with respect to distance. This figure quantitatively validates the bias of cardiovascular disorders toward clustering in the GDD network. Two examples of cardiovascular disease pairs with significant protein-protein interactions: (c) Ischemic stroke and myocardial infarction (PPIs = 15; p << 0.01, z-test), and (d) Long QT syndrome and Carney complex (PPIs = 3; p = 1.88E-57, z-test). The blue-filled rectangles are cardiovascular disease genes. The rectangles with red border are cardiovascular targets. The blue-filled rectangles with red border are both cardiovascular targets and genes. Other proteins are the neighbors of cardiovascular genes. See Additional file 1for the global cardiovascular disease modular network.
