Figure 4.

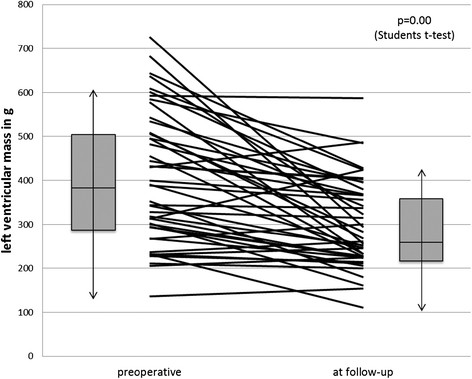
Development of left ventricular mass in each patient (lines) and for the whole echocardiographicly examined study cohort (Boxplots: box equals interquartile range with median and whiskers of 1.5× interquartile range).

Development of left ventricular mass in each patient (lines) and for the whole echocardiographicly examined study cohort (Boxplots: box equals interquartile range with median and whiskers of 1.5× interquartile range).