
Figure 5.
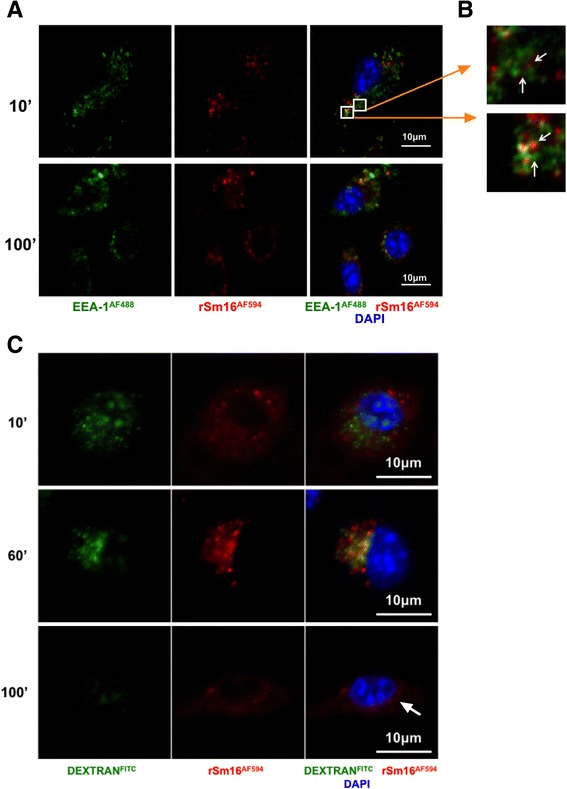
Uptake of fluorescently labelled rSm16 by BMMΦs. Representative confocal images of (A) BMMΦs exposed to labelled rSm16AF594 (red) stained with DAPI (blue) within EEA-1+ endosomes (green) 10 min and 100 min after ligand stimulation. (B) Insert showing EEA-1+ endosomes containing rSm16AF594 (2 μm x 2 μm) (C) BMMΦs exposed for 100 min to rSm16AF594 (red) and DEXTRANFITC (green) washed and imaged after 10, 60 and 100 min. (63x objective, scale bar = 10 μm; acquired using a Zeiss LSM 710 invert microscope).