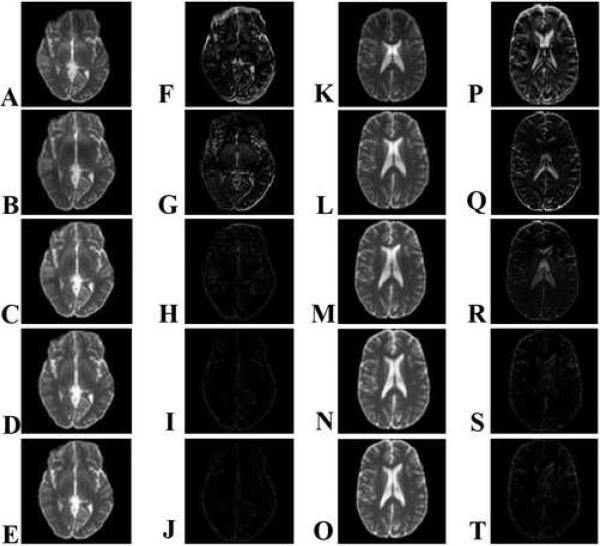
Fig. 6.
(A-E, K-O) Intensity and (F-J, P-T) absolute difference images with respect to ground truth images for two sample slices from dataset A at various stages in the CFMMSV correction process. (Top row) Geometrically distorted dataset, (second row) cycle 0, (third row) cycle 1, (fourth row) cycle 2, (fifth row) cycle 3. All images are displayed on the same normalized intensity scale ranging from 0 to 1.

