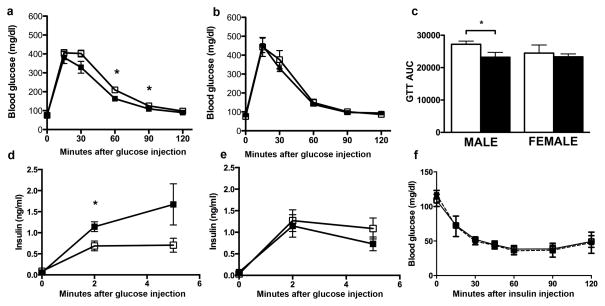
Figure 2.
Eight-week-old male ODM have improved glucose tolerance due to increased insulin response to hyperglycemia. For all graphs, OCM is shown in white, and ODM is in black. (a,b) A GTT was administered to fasted 8-week old (a) male and (b) female rats. *p<0.05 by repeated measures ANOVA followed by Sidak’s multiple comparisons. (c) Area under the curve (AUC) measurements for GTT are shown. Significant effects of ODM were observed by two-way ANOVA. *p<0.05 by Tukey’s multiple comparisons. OCM: open bars; ODM: closed bars. For panels (a,b,c) n=8 males and n=7 females. (d, e) Insulin levels were quantified in a separate cohort of OCM and ODM within 5 minutes after glucose injection. Graphs show plasma insulin levels before and after glucose injection for (d) males (OCM n=8, ODM n=8) and (e) females (OCM n=7, ODM n=9). *p<0.05 by repeated measures ANOVA followed by Sidak’s multiple comparisons. (f) ITTs were performed on 8-week old male OCM and ODM. Graph shows glucose levels at various times after injection of insulin (n=4 OCM and ODM). No significant differences in insulin tolerance were detected using repeated measures ANOVA. Graphs show mean and SEM values.

