
Extended Data Figure 7.
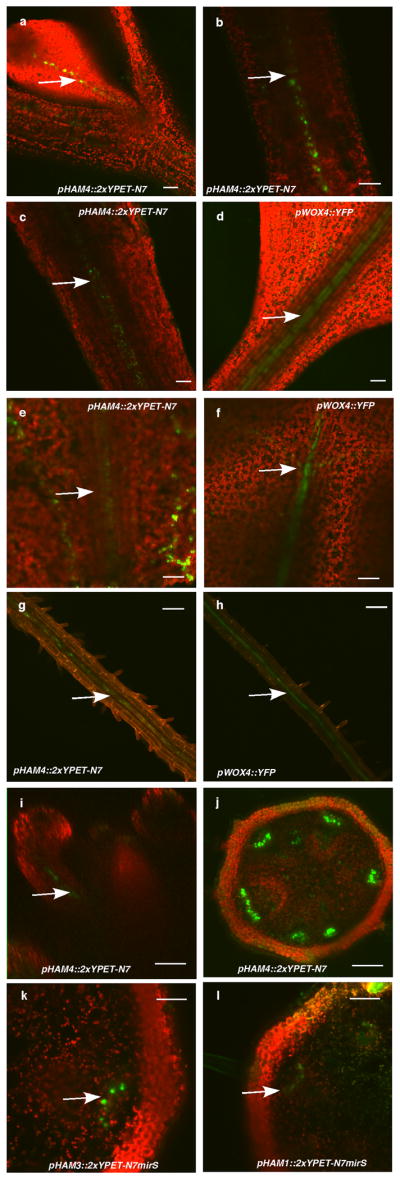
Expression patterns of HAMgenesin comparison to WOX4. (a) pHAM4::2xYPET-N7 (green, arrow indicated) is expressed in procambium cells of the first leaf. (b) pHAM4::2xYPET-N7 (green, arrow indicated) is expressed in vasculature in the 7-day-old hypocotyl. (c–h) Comparison of pHAM4::2xYPET-N7 (green, arrow indicated) and pWOX4::YFP (green, arrow indicated) expression patterns in vasculature cells in the 7-d-old leaf petiole (c–d),20-d-old leaf petiole (e–f) and 7-d-old root (g–h). (i) Orthogonal view of pHAM4::2xYPET-N7 (green, arrow indicated) expression in flower vasculature. (j) Procambium-specific expression of pHAM4::2xYPET-N7 in stems from 1cm bolting plants. (k–l) Procambium-specific expression of pHAM3::2xYPET-N7mirS (k) and pHAM1::2xYPET-N7mirS (l) in transverse sections of stems from 1 cm bolting plants. Red in (a–f, i–l) represents chlorophyll autofluorescence, and represents PI staining in (g–h). Bars = 50μm in (a, h–i, k–l); 100μm in (b–g, j).