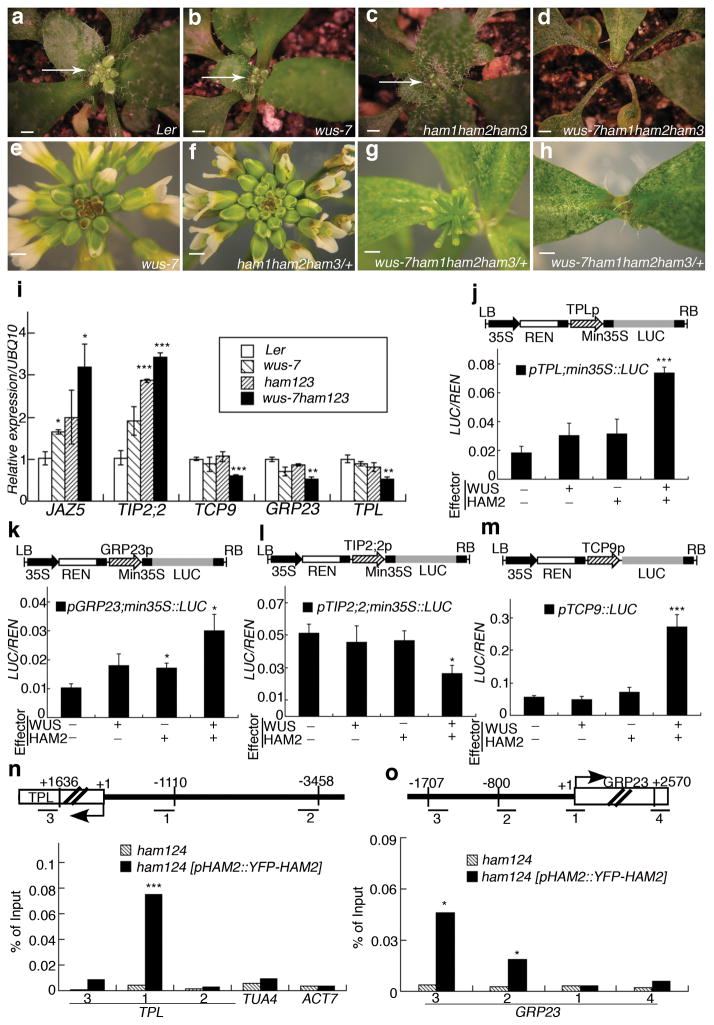
Figure 2. WUS and HAM family genes cooperatively control the shoot stem cell niche and co-regulate a common gene set.
Shoot apices (a–d) (arrows) and inflorescence structures(e–h)of plants in indicated genotypes. Bars = 2 mm in (a–h).(i) RT-PCR quantification of WUS and HAM target gene expression in indicated genotypes. Error bar = mean ± sem(n=3 biological replicates). (j–m) LUC/REN activity in tobacco cells co-transformed with different reporter constructs (structured above each graph) and indicated effectors(see Methods). Min35S: 60 base pair 35S minimum element, REN: Renilla luciferase, LUC: firefly luciferase, LB/RB: T-DNA left or right border. Error bar = mean ± sem(n=3biological replicates). (n–o) Chromatin Immunoprecipitation of HAM2 protein with TPL or GRP23 chromatin regions, with ampliconlocations (Bars with numbers) diagrammed above each graph. The ChIP experiments were repeated three times using independent biological replicates with similar results, and one representative data set is shown.*, P<0.05; **, P<0.01; ***, P<0.001(two-tailed t-test) in (i–o).

