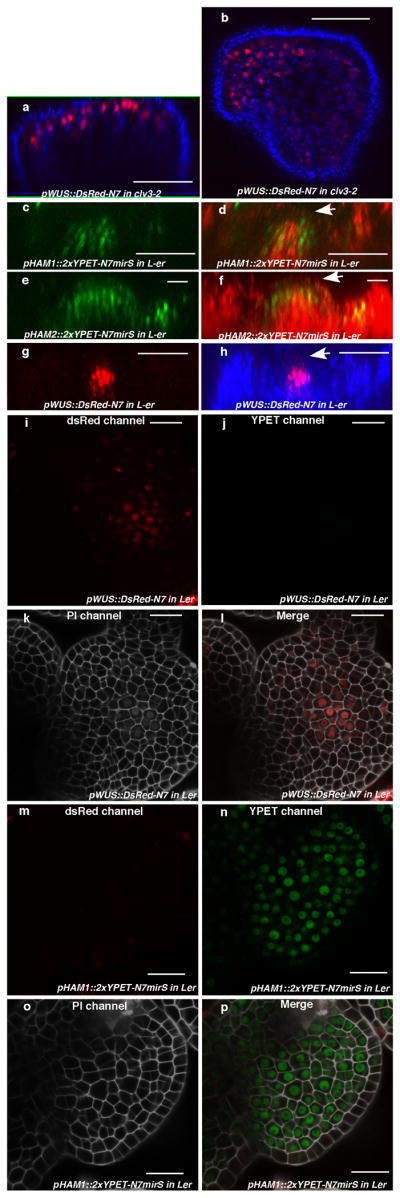
Extended Data Figure 5.

Expression of HAM1, HAM2 and WUS in the SAMs. (a–b) WUS expression in clv3-2. Orthogonal (a) andtop (b) views of pWUS::DsRed-N7 expression (red)and chlorophyll autofluorescence (blue) in the same clv3-2 inflorescence meristem. (c–h) Comparison between expression patterns of HAM1, HAM2 and WUS in vegetative meristems.(c) Orthogonal view of pHAM1::2xYPET-N7mirS expression (green) in Ler vegetative meristem. (d) Orthogonal view of pHAM1::2xYPET-N7mirS expression (green) together with chlorophyll autofluorescence (red) in the same vegetative meristem shown in (c), indicating that HAM1 is expressed in the rib meristem. (e) Orthogonal view of pHAM2::2xYPET-N7mirS expression (green) in Ler vegetative meristem. (f) Orthogonal view of pHAM2::2xYPET-N7mirS expression (green) together with chlorophyll autofluorescence (red) in the same vegetative meristem shown in (e), indicating that HAM2 is highly expressed in the rib meristem. (g) Orthogonal view of pWUS::DsRed-N7 expression (red) in Ler vegetative meristem. (h) Orthogonal view of pWUS::DsRed-N7 expression (red) together with chlorophyll autofluorescence (blue) in the same vegetative meristem shown in (g), indicating that WUS is expressed in the rib meristem. Arrows indicate the positions of L1 cell layer. (i–p) Control images confirming the specificity of confocal spectral settings for Fig. 3(e–l). The SAMs from pWUS::DsRed-N7 line (i–l) or pHAM1::2xYPET-N7mirS line (m–p) were imaged from the same three separated channels used in Fig. 3 (e–l). There is no spectral bleed-through of YPET signal into the ds Red channel (m), nor ds Red signal into the YPET channel (j). (i, m)ds Red channel (red); (j, n) YPET channel (green); (k, o) PI staining channel (gray); (l, p) merged all three channels. Bars = 50μm in (a–d, g–h), 20 μm in (e–f, i–p).
