
Fig. 1. Neuroanatomical characterization of Dlx-DOR mice.
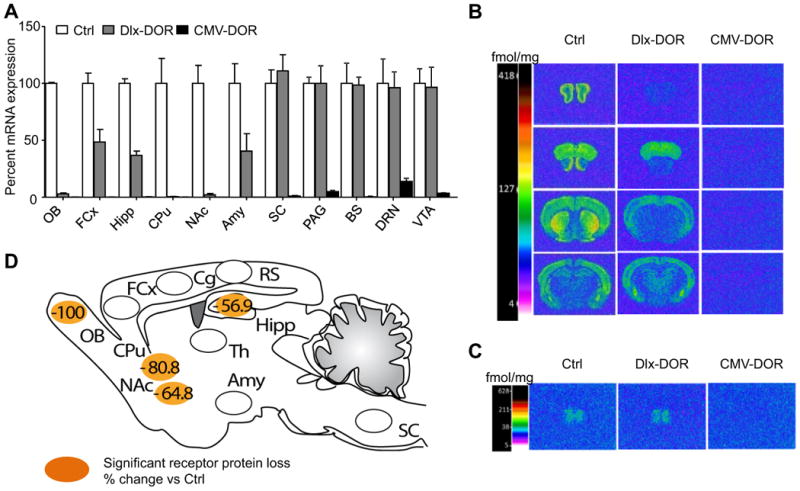
(A) Quantitative RT-PCR. DOR mRNA levels were measured in microdissected samples from Control (Ctrl, white bars), Dlx-DOR (conditional mutant, grey bars) and CMV-DOR (constitutive mutant, black bars) mice (n=3-4/group). Data were normalized using the housekeeping gene 36B4. Expression levels of mutants are expressed as percent change compared to control levels. The DOR transcript was undetectable in OB, CPu and NAc, partially decreased in FCx, Hipp and Amy and unchanged in SC, PAG, BS, DRN and VTA of Dlx-MOR mice, and was undetectable overall in CMV-DOR mice. (B-C) Quantitative DOR ligand binding autoradiography. Brain sections were labeled with [3H] deltorphin-1 and all sections were processed in parallel throughout binding and development of autoradiograms. Representative autoradiograms from brain (B) and SC (C) sections are shown for the three genotypes. The color bar code shows a pseudo-colour interpretation of relative densities from black and white images calibrated in fmol/mg tissue. Non-specific binding was homogenous and at background levels. Values and statistics are shown in Table 1. (D) Summary of DOR protein levels in Dlx-DOR mice compared to control mice, adapted from Table 1. Regions in orange correspond to brain areas showing significant reduction of DOR protein, and numbers represent percent change of DOR protein levels in conditional mutant mice from Table 1. Abbreviations: Amy, amygdala; Cg, cingulated cortex; BS, brainstem; CPu, caudate-putamen nucleus; DRN, dorsal raphe nucleus; FCx, frontal cortex; Hipp, hippocampus; NAc, nucleus accumbens; OB, olfactory bulb; PAG, periaqueducatal gray; RS, retrosplenial cortex; SC, spinal cord; VTA, ventral tegmental area.