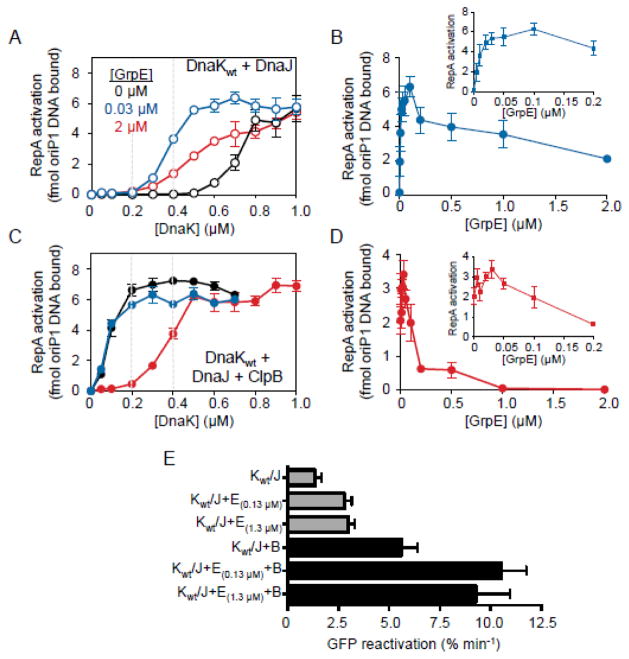
Fig. 5.
The effect of GrpE on protein activation and remodeling by DnaK, DnaJ and ClpB. A, C. RepA was incubated with ATP, DnaJ and increasing concentrations of DnaKwt in the presence of 0 μM, 0.03 μM or 2 μM GrpE without ClpB (A) or with 180 nM ClpB (C), as indicated. RepA activation was measured as described in Methods. In A and C, gray dashed lines at 0.2 and 0.4 μM DnaK are present to aid the eye. B, D. RepA was incubated with 0.4 μM DnaKwt (B) or 0.1 μM DnaKwt (D), DnaJ and ATP in the presence of increasing GrpE concentrations without (B) or with 20 nM ClpB (D) as indicated. RepA activation was measured as described in Methods. E. DnaKwt (1.4 μM) and DnaJ (0.25 μM) were incubated with hdGFP and ATP in the absence or presence of ClpB (0.25 μM) and GrpE as indicated. The increase in fluorescence intensity was monitored over time. Initial rates of reactivation of hdGFP were determined as described in Methods. Data in A–E are means ± SEM (n=3). Some error bars are hidden by symbols.

