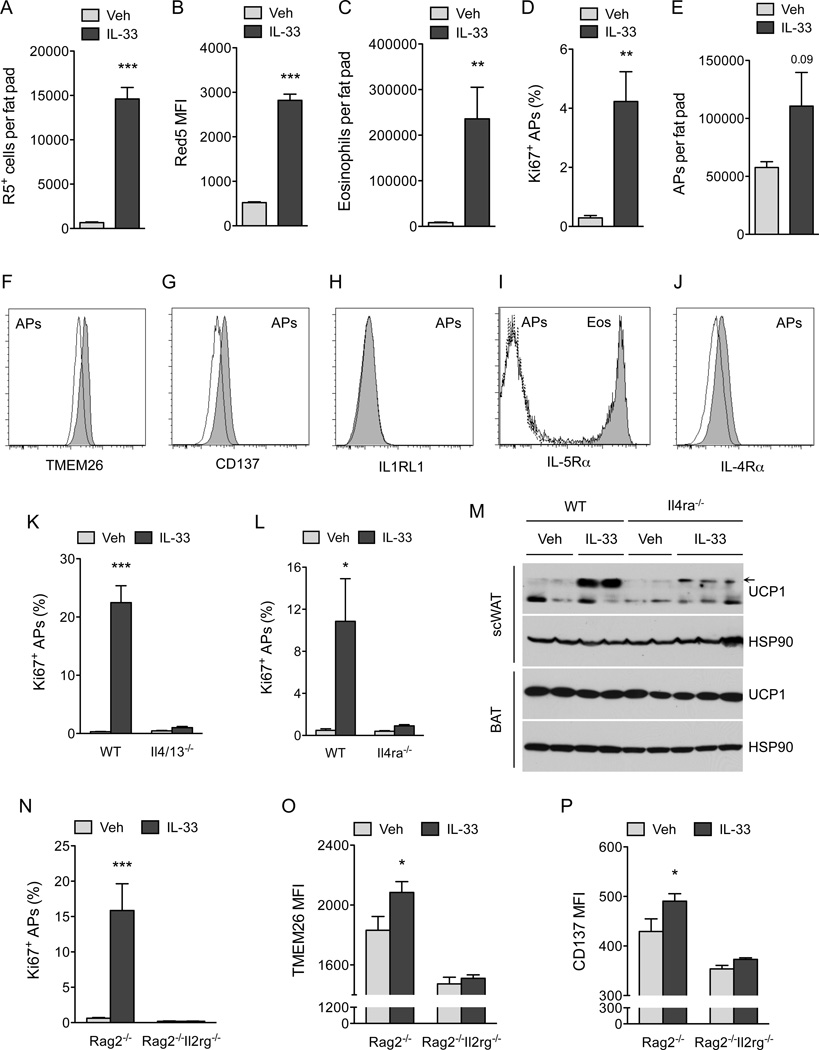
Figure 2. IL-33 stimulates proliferation and commitment of adipocyte precursors to the beige fat lineage.
(A, B) Quantification of ILC2 numbers (A) and activation status (B) in the scWAT of thermoneutral, heterozygous Red5 (Il5Red5/+) mice that were administered vehicle (Veh) or IL-33 for 8 days. Expression of IL-5 (td Tomato) from the Red5 allele was used as a marker of ILC2 activation (n=9–10 per treatment). (C) Quantification of eosinophils in the scWAT of thermoneutral heterozygous Red5 (Il5Red5/+) mice that were administered Veh or IL-33 for 8 days (n=8–10 per treatment). (D) Quantification of adipocyte precursor (AP) proliferation in the scWAT of thermoneutral Il5Red5/+ mice administered Veh or IL-33 for 8 days, as assessed by intracellular staining for Ki67 (D) and AP cell number per fat pad (n=8–10 per treatment). (F, G) Expression of beige adipocyte markers TMEM26 and CD137 on the scWAT APs of thermoneutral Il5Red5/+ mice administered Veh or IL-33 for 8 days (n=8–10 per treatment). Representative histograms for TMEM26 (F) and CD137 (G) are shown; clear histogram-Veh, shaded histogram-IL-33. (H–J) Expression of IL1RLI (H), IL-5Rα (I), and IL-4Rα (J) on scWAT APs of mice. For IL1RL1 (H), the clear histogram represents WT APs, while the shaded represents Il1rl1−/− APs. For IL-5Rα (I), the dashed line histogram represents isotype, the solid line represents APs stained for IL-5Rα, and the shaded histogram represents eosinophils stained for IL-5Rα. For IL-4Rα (J), the solid line histogram represents isotype and the shaded histogram represents APs stained for IL-4Rα. (K, L) Quantification of IL-33 induced AP proliferation in the scWAT of 114/13−/− (K) and Il4ra−/− (L) mice (n=4–8 per genotype and treatment). (M) Immunoblotting for UCP1 in the scWAT and BAT of thermoneutral WT and Il4ra−/− mice administered IL-33 for 8 days (n=2–3 per genotype and treatment). (N–P) Quantification of AP proliferation (N), TMEM26 (O) and CD137 (P) expression in Rag2−/− and Rag2−/− Il2rgc−/− mice treated with IL-33 (n=6–8 per genotype and treatment). Data are represented as mean ± SEM. See also Figure S1 and S2.

