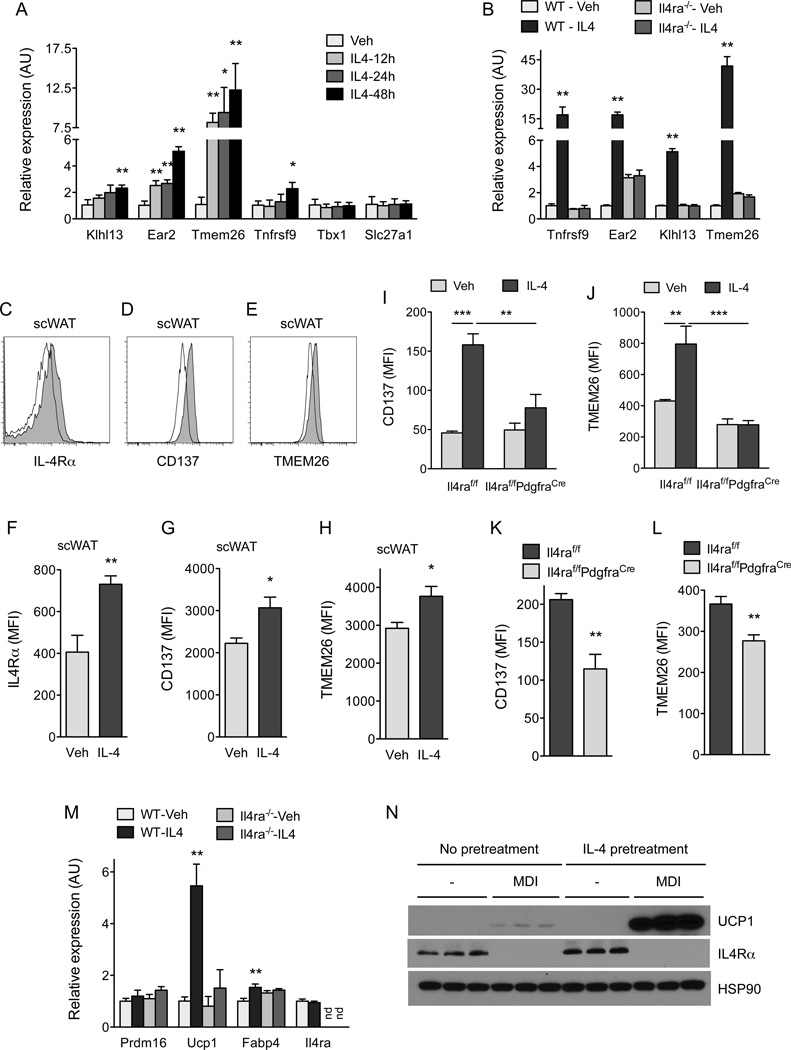
Figure 5. IL-4 and IL-13 direct commitment of PDGFRα+ adipocyte precursors to beige adipogenic precursors.
(A) Quantitative RT-PCR analysis of beige adipocyte precursor markers in APs purified from the scWAT of C57BL/6J stimulated with vehicle or IL-4 (n=3 per condition and time point; data presented as mean ± SD). (B) Quantitative RT-PCR analysis of beige adipocyte precursor markers in APs purified from Balb/cJ or Il4ra−/− mice that were stimulated with vehicle or IL-4 for 48 hours (n=3 per genotype and treatment; data presented as mean ± SD). (C–E) Flow cytometric analysis of IL-4Rα (C), CD137 (D) and TMEM26 (E) expression in scWAT APs of mice injected with vehicle or IL-4. Clear histogram: vehicle; shaded histogram: IL-4. (F–H) Quantification of IL-4Rα, CD137, and TMEM26 expression in scWAT APs 48 hours after administration of vehicle or IL-4 (n=5 per treatment). (I, J) Quantification of CD137 and TMEM26 expression in the scWAT APs of Il4raf/f and Il4raf/f/PdgfraCre mice 48 hours after administration of IL-4 (n=4–6 per genotype and treatment). (K, L) Quantification of CD137 and TMEM26 expression in the scWAT APs of 5 week-old Il4raf/f and Il4raf/f/PdgfraCre mice (n=8–12 per genotype). (M) Quantitative RT-PCR analysis of beige/brown adipocyte genes after in vitro differentiation of scWAT APs purified from Balb/cJ or Il4ra−/− mice (n=3 per genotype and treatment; data presented as mean ± SD). (N) Immunoblot analysis for UCP1 and IL-4Rα in in vitro-differentiated APs. MDI refers to stimulation of differentiation by adipogenic cocktail, (n=3 genotype and treatment). Unless otherwise indicated, data are represented as mean ± SEM. See also Figure S5 and S6.

