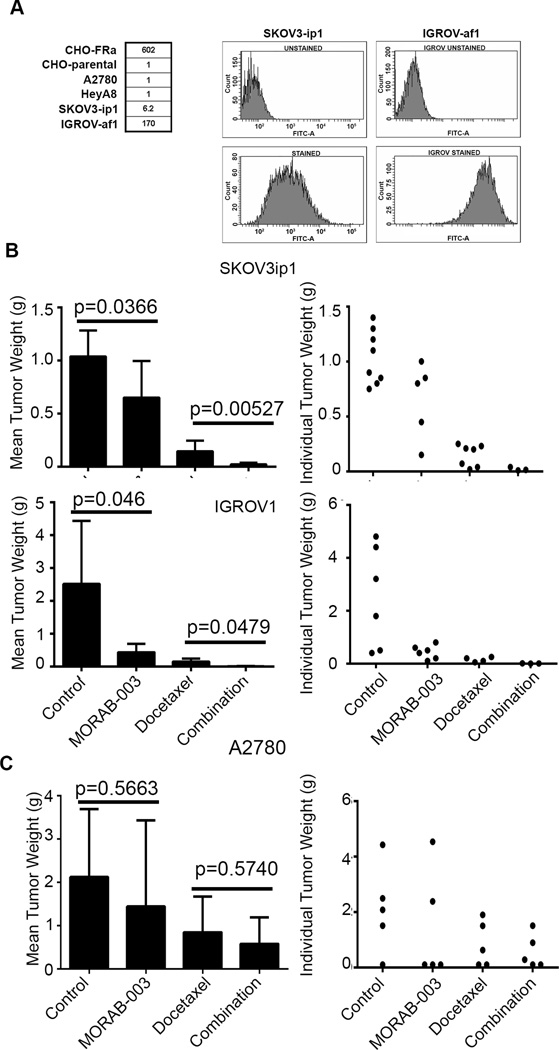
Figure 1. In vivo therapeutic effects of MORAB-003 on growth of human ovarian cancer.
(A) Left panel: FACS analysis revealed the absence of FRα expression in CHO parental cells, while high expression was confirmed in the transfected cell line CHO-FRα. Numbers represent relative fluorescence. Right panel: FACS plot showed that both SKOV3ip1 and IGROV1 cell lines expressed high levels of FRα.
(B) Effects of MORAB-003 and docetaxel on tumor growth in SKOV3ip1 and IGROV1 orthotopic mouse models. Left panel: SKOV3ip1: P <0.05 (control vs. MORAB-003); P <0.001(control vs. MORAB-003+docetaxel [Combination]). IGROV1: P <0.05 (control vs. MORAB-003); P <0.001 (control vs. MORAB-003+docetaxel). Right panel: Weights of individual tumors from each mouse are shown.
(C) Effects of MORAB-003 and docetaxel on tumor growth in the low-FRα A2780 orthotopic mouse model. Left panel: P >0.05 (control vs. MORAB-003). Right panel: Weights of the tumors from each mouse are shown. Error bars represent SEM.

