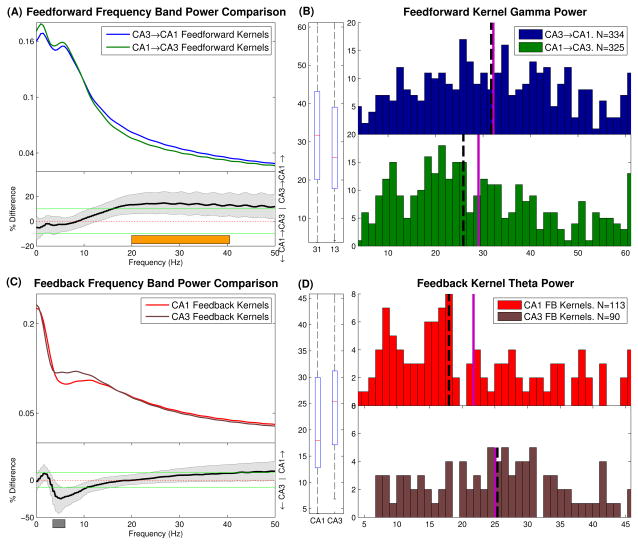
Fig. 11.
Frequency power band di3erences between CA3→CA1 and CA1→CA3 models. (A) Feedforward kernels. Top: mean band power per frequency for both classes. Bottom: Mann-Whitney scale estimate and confidence bounds for every frequency in the 0–50Hz range. Positive values reflect CA3→CA1 model is greater. Differences are significant whenever confidence bounds do not include 0. Notice CA3→CA1 models have significantly greater beta/low gamma band power (20–40 Hz, indicated by orange bar). (B) Histograms and boxplot of band power values for the beta/low gamma range which are shown in A. Solid violet line and dashed black line show the mean and median of the data, respectively. The boxplot labels of 31 and 13 refer to CA3→CA1 and CA1→CA3 respectively. (C,D) Same as A,B for Feedback kernels. Notice CA3 neurons have significantly greater feedback theta components (4-6 Hz, indicated by grey bar)

