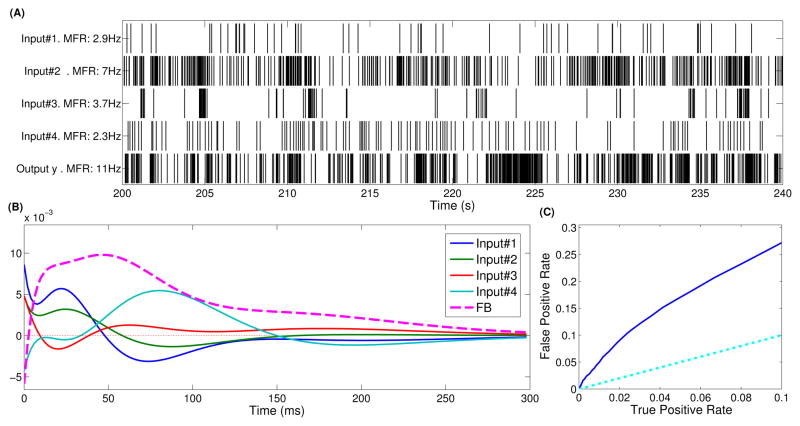
Fig. 3.
Representative CA1→CA3 model with 4 inputs and a single output. (a) Rasterplots of input and output activity over 4 minutes. MFR is abbreviation for mean firing rate. (b) Estimated input (feedforward) and feedback kernels. Notice that many kernels have both excitatory (positive area) and inhibitory (negative area) effects. Furthermore, input kernels #1 and #4 display strong theta oscillations. (c) ROC plot showing model predictive power. The light blue line (TPR=FPR) indicates a model with no predictive power. AUC=668.001. For this model, ρ=0.11

