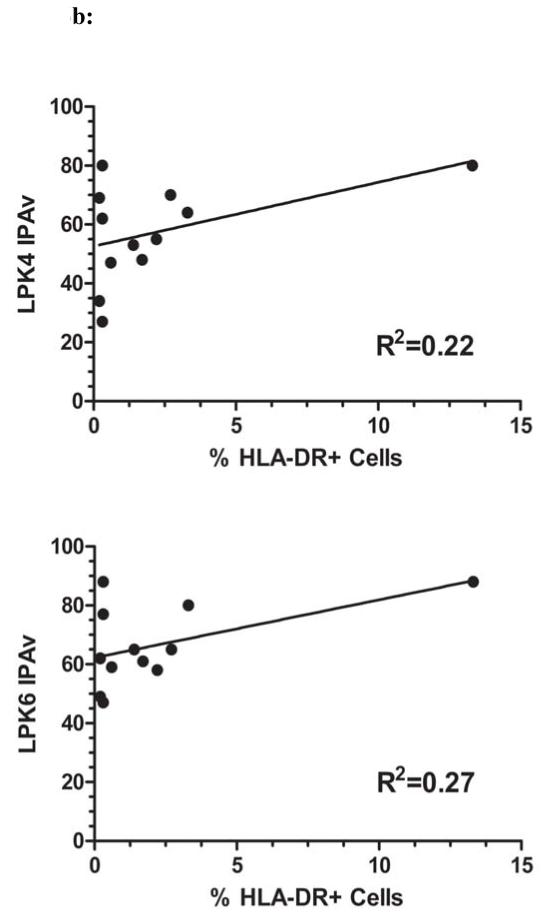
Figure 6. IPAv Correlation with Viability and MHC Class II.
Figure 6a: The IPA values for each product were assessed for their degree of correlation with the cell viability of that product. IPAv’s from assays using either LPK4 or LPK6 were used. The correlation coefficients were R2=0.21 and R2=0.12 for LPK4 and LPK6, respectively. Figure 6b: IPA values for products were evaluated for correlation with cell surface HLA-DR (MHC Class II) expression which was measured using flow cytometry analysis. The correlation coefficients were R2=0.22 and R2=0.27 for LPK4 and LPK6, respectively.


