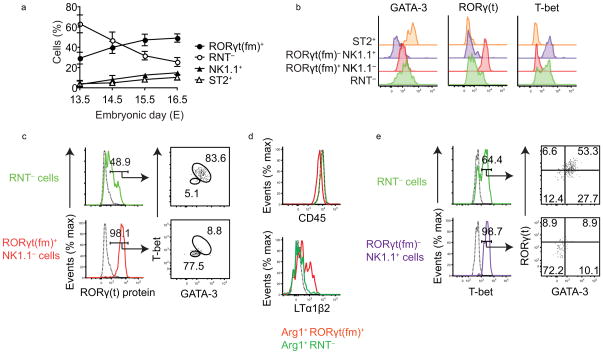
Figure 4.
Characterization of Arg1YFP+RNT− cells. (a) The frequency of each ILC population as a percent of total YFP+ cells (n = 5–7). Shown are the mean+/-s.d. P<0.001 for all comparisons with RNT− cells at E13.5 (one-way ANOVA followed by Tukey’s test). (b) Transcription factor expression in Arg1YFP+RNT− cells compared to other Arg1YFP+ ILC populations. (c) GATA-3 and T-bet expression in RORγt protein-expressing RNT− cells compared to RORγt(fm)+ cells. (d) CD45 and LTα1β2 expression in Arg1YFP+RNT− cells and Arg1YFP+RORγt(fm)+ LTi cells. The dotted black line represents ILC2s in the CD45 plot, and an Ig control in the LTα1β2 plot. (e) RORγt and GATA-3 protein expression in T-bet-expressing RNT− cells compared to RORγt(fm)−NK1.1+ cells. Data are representative of three independent (b–e) or two independent experiments (a).

