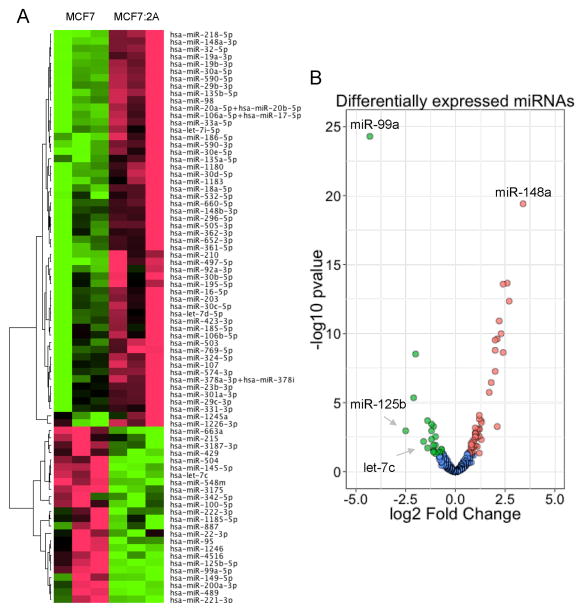
Figure 1. Differentially expressed miRNAs in MCF7:2A vs. MCF7 cells.
MCF7 and MCF7:2A cells were grown under standard culturing conditions, and small RNAs were extracted from each cell line. Each sample was then assayed for the expression of miRNA using nCounter NanoString assays. A) Heatmap demonstrating the differentially expressed miRNAs found in the MCF7:2A and MCF7 cells including 54 upregulated and 24 downregulated miRNAs. B) Volcano plot demonstrating the profile of the differentially expressed miRNAs in MCF7:2A vs. MCF7 cells. This plot demonstrates the fold change (x-axis) and significance level expressed as the −log10 p-value (y-axis). The green circles represent the miRNAs downregulated in the MCF7:2A compared with MCF7 cells, and the red circles represent the miRNAs upregulated in the MCF7:2A compared with MCF7 cells. The blue circles indicate miRNAs that were not significantly expressed. Significance was determined with a p-value cutoff of 0.05 and a 1.5 fold change.

