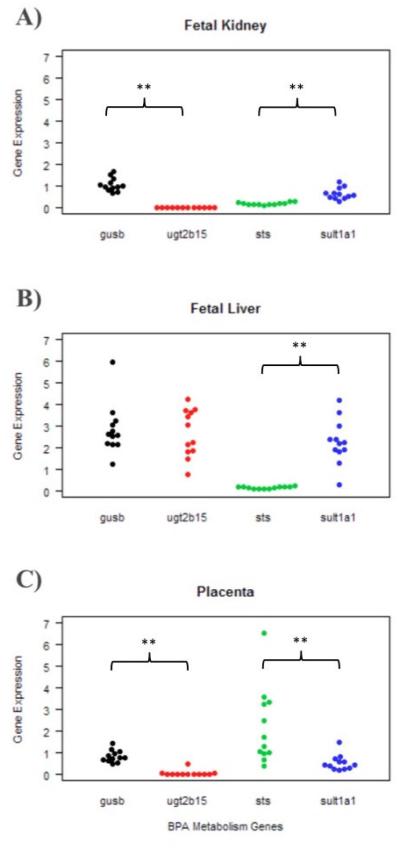
Figure 2. BPA-related metabolism gene expression profiles are generally similar across tissue.
The dot plot displays the normalized gene expression values for all 12 subjects for four genes: GUSB, UGT2B15, STS, and SULT1A1. Each panel shows the expression profiles by tissue type: (A) fetal kidney (B) fetal liver and (C) placenta. GUSB expression was significantly higher than UGT2B15 expression within fetal kidney and placenta, while SULT1A1 expression was significantly higher than STS expression in fetal kidney and fetal liver samples (p-values <0.01 as represented by **). When an ANOVA test was conducted across the three tissues for GUSB, UGT2B15, STS, and SULT1A1 separately, there were significant tissue-dependent differences in expression (p-values <0.001).

