
Figure 2. Regulatory properties of all phosphorylation sites.
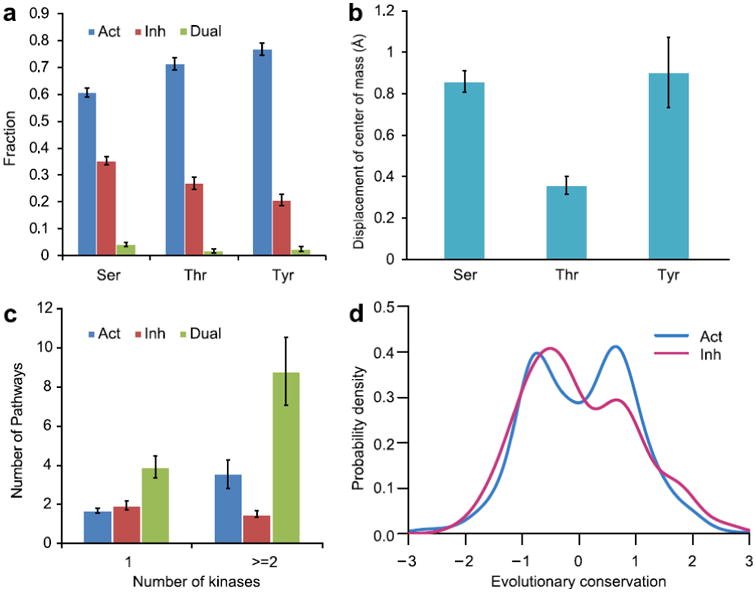
a: fraction of phosphorylation sites with a given functional consequence (Act –activating, 1068 sites; Inh – inhibitory, 489 sites and Dual – dual phosphosites, 52 sites) for different residue types plotted with the standard errors. b: mean value of displacement of side chain center of mass upon phosphorylation; standard error bars are shown. c: relationship between the numbers of kinases and pathways regulated by phosphosites with different functions. d: evolutionary conservation of phosphosites. Positive conservation score corresponds to sites that are more evolutionary conserved compared to other sites in a protein family. Conservation distribution for activating sites can be described by two normal distributions. The distributions were smoothed by the Gaussian kernel density estimation.