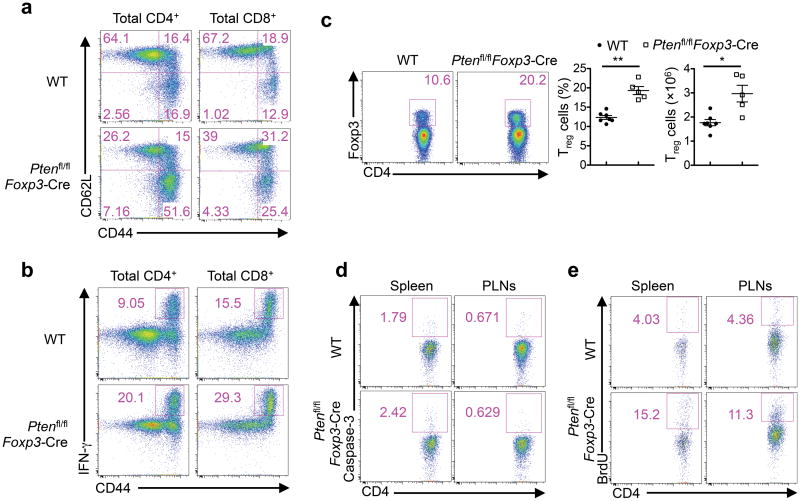
Figure 2. Increased T cell activation and altered immune homeostasis in Ptenfl/flFoxp3-Cre mice.
(a) Expression of CD62L and CD44 on WT and Ptenfl/flFoxp3-Cre splenic T cells. Numbers in quadrants indicate percent cells in each. (b) Expression of IFN-γ in CD4+ and CD8+ T cells of WT and Ptenfl/flFoxp3-Cre mice. (c) Flow cytometry analysis of Treg cells in WT and Ptenfl/flFoxp3-Cre splenic CD4+ T cells. Below, the frequency and numbers of Treg cells. (d,e) Caspase-3 activity (d) and BrdU staining at 16 h after injection of BrdU (e) in Treg cells from the spleen and peripheral lymph nodes (MLNs) of WT and Ptenfl/flFoxp3-Cre mice. Data are representative of at least ten independent experiments (a-c) and two independent experiments (d,e). *P < 0.05 and **P < 0.001. Data are mean ± s.e.m.

