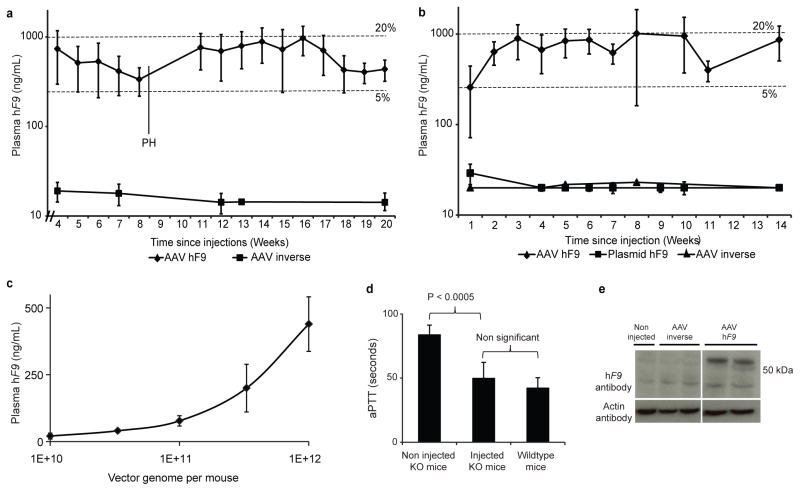
Figure 2. Human factor IX expression and activity in injected mice.
a. Plasma hF9 measured by ELISA following IP injections of 2-day-old B6 mice with 2.5e11 vg per mouse of either the hF9 experimental construct (n = 6) or inverse control (n = 3). The limit of detection was 20 ng/mL. PH = partial hepatectomy. Error bars represent standard deviation. Dashed lines denote 5% and 20% of normal F9 levels. b. Plasma hF9 measured by ELISA following tail vain injections of 9-week-old B6 mice with 1e12 vg per mouse of either the AAV hF9 experimental construct (n = 7), or inverse control (n = 3), or a hydrodynamic injection of 30 μg plasmid (3.5e12 copy number) coding for the hF9 construct in the “correct” orientation. The limit of detection was 20 ng/mL. Error bars and dashed lines as in (a). c. Plasma hF9 measured by ELISA following tail vain injections of 9-week-old B6 mice with the designated vector dose of AAV-hF9 experimental construct (n = 4 for each dose group). Error bars represent standard deviation. d. Measurement of coagulation efficiency by activated partial thromboplastin time (aPTT) 2 weeks after tail vain injections of AAV8-hF9 at 1e12 vg per mouse (n = 5). Error bars represent standard deviation. e. Western blot analysis for hF9 in liver samples from mice injected with the AAV8-hF9 construct or inverse control. The expected size of hF9 is 55-Kd.

